

Performance and workflow assessment of six nucleic acid extraction technologies for use in resource limited settings
- PMID: 30998749
- PMCID: PMC6472818
- DOI: 10.1371/journal.pone.0215753
Performance and workflow assessment of six nucleic acid extraction technologies for use in resource limited settings
Abstract
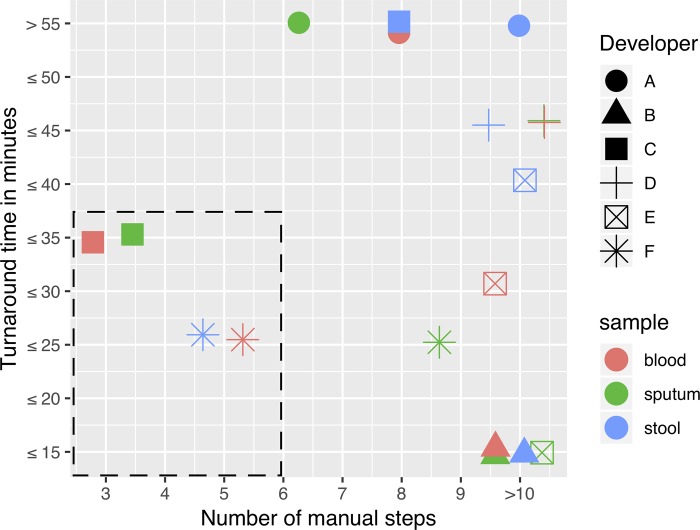
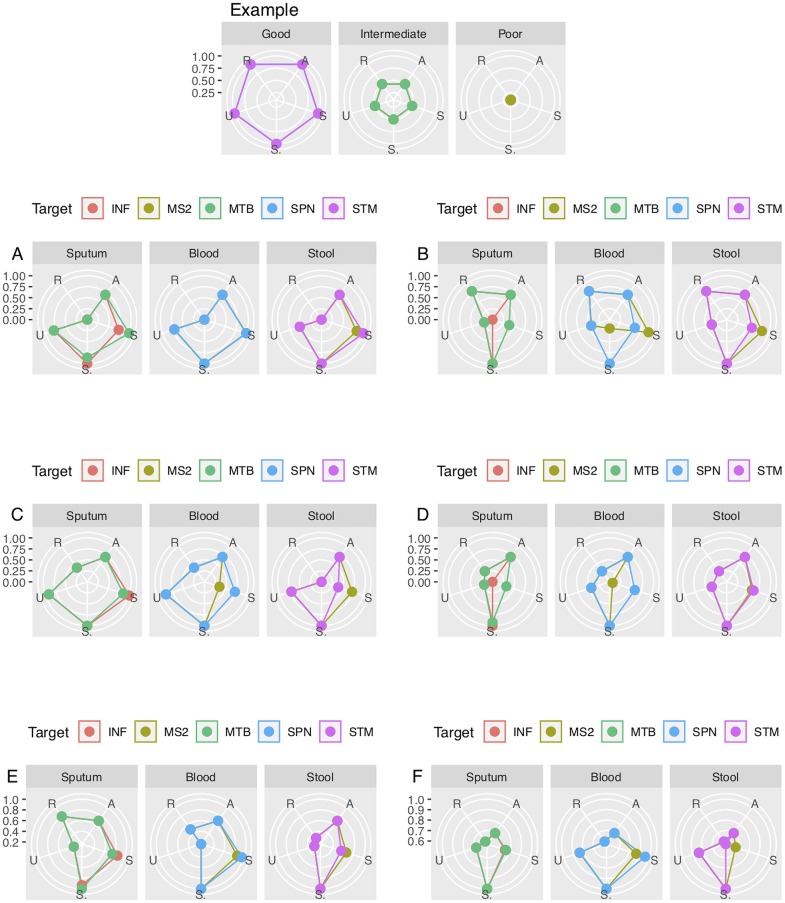
Infectious disease nucleic acid amplification technologies (NAAT) have superior sensitivity, specificity, and rapid time to result compared to traditional microbiological methods. Recovery of concentrated, high quality pathogen nucleic acid (NA) from complex specimen matrices is required for optimal performance of several NA amplification/detection technologies such as polymerase chain reaction (PCR). Fully integrated NAAT platforms that enable rapid sample-to-result workflows with minimal user input are generally restricted to larger reference lab settings, and their complexity and cost are prohibitive to widespread implementation in resource limited settings (RLS). Identification of component technologies for incorporation of reliable and affordable sample preparation with pathogen NA amplification/detection into an integrated platform suitable for RLS, is a necessary first step toward achieving the overarching goal of reducing infectious disease-associated morbidity and mortality globally. In the current study, we evaluate the performance of six novel NA extraction technologies from different developers using blinded panels of stool, sputum and blood spiked with variable amounts of quality-controlled DNA- and/or RNA-based microbes. The extraction efficiencies were semi-quantitatively assessed using validated real-time reverse transcription (RT)-PCR assays specific for each microbe and comparing target-specific RT-PCR results to those obtained with reference NA extraction methods. The technologies were ranked based on overall diagnostic accuracy (analytical sensitivity and specificity). Sample input and output volumes, total processing time, user-required manual steps and cost estimates were also examined for suitability in RLS. Together with the performance analysis, these metrics were used to select the more suitable candidate technologies for further optimization of integrated NA amplification and detection technologies for RLS.
Conflict of interest statement
Jim Gallarda is an employee of the BMGF. This does not alter our adherence to PLOS ONE policies on sharing data and materials.
Figures
References
-
- Halse TA, Edwards J, Cunningham PL, Wolfgang WJ, Dumas NB, Escuyer VE, et al. Combined real-time PCR and rpoB gene pyrosequencing for rapid identification of Mycobacterium tuberculosis and determination of rifampin resistance directly in clinical specimens. J Clin Microbiol. 2010;48: 1182–1188. 10.1128/JCM.02149-09 - DOI - PMC - PubMed
Publication types
MeSH terms
Substances
LinkOut - more resources
Full Text Sources
Miscellaneous
