Diagnostic test accuracy: application and practice using R software
- PMID: 30999739
- PMCID: PMC6545496
- DOI: 10.4178/epih.e2019007
Diagnostic test accuracy: application and practice using R software
Abstract
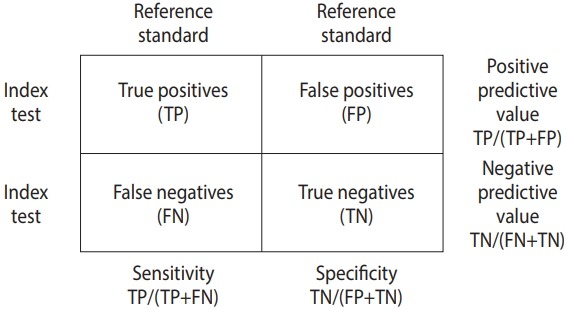
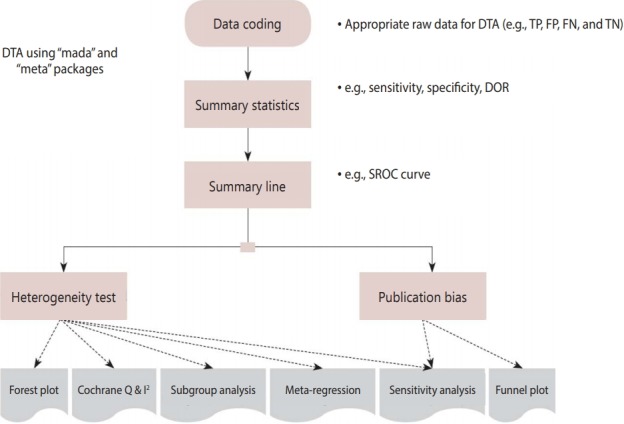
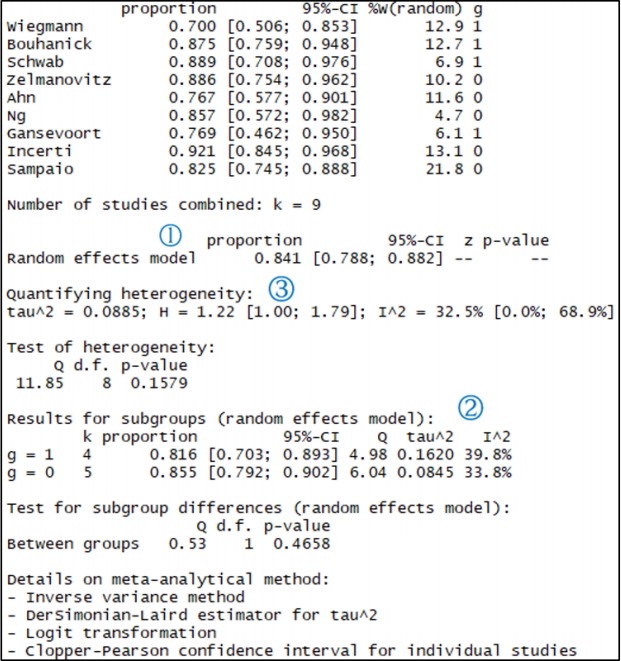
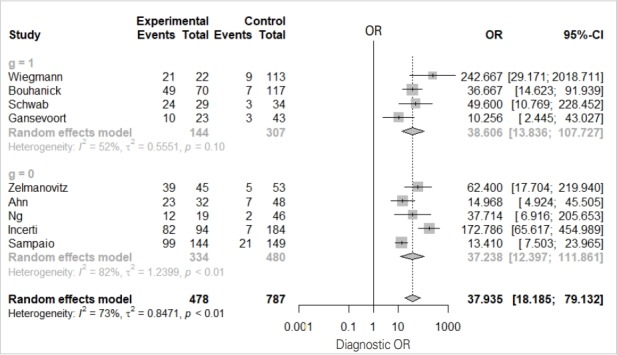
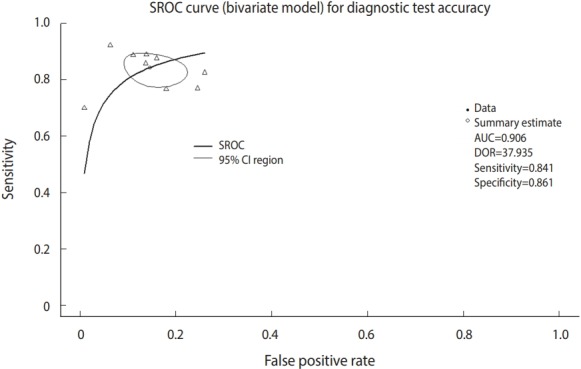
The objective of this paper is to describe general approaches of diagnostic test accuracy (DTA) that are available for the quantitative synthesis of data using R software. We conduct a DTA that summarizes statistics for univariate analysis and bivariate analysis. The package commands of R software were "metaprop" and "metabin" for sensitivity, specificity, and diagnostic odds ratio; forest for forest plot; reitsma of "mada" for a summarized receiver-operating characteristic (ROC) curve; and "metareg" for meta-regression analysis. The estimated total effect sizes, test for heterogeneity and moderator effect, and a summarized ROC curve are reported using R software. In particular, we focus on how to calculate the effect sizes of target studies in DTA. This study focuses on the practical methods of DTA rather than theoretical concepts for researchers whose fields of study were non-statistics related. By performing this study, we hope that many researchers will use R software to determine the DTA more easily, and that there will be greater interest in related research.
Keywords: Diagnostic test accuracy; Likelihood ratios; Mada; Meta-analysis; Receiver-operating characteristic curve; Reitsma.
Conflict of interest statement
The authors have no conflicts of interest to declare for this study.
Figures
References
-
- Hwang SD, Shim SR. Meta-analysis: from forest plot to network meta-analysis. Seoul: Hannarae; 2018. pp. 224–246. (Korean)
-
- Shim SR. Diagnostic test accuracy using R & Meta-DiSc software. Gwacheon: SDB Lab; 2019. (Korean)
-
- Shim SR, Shin IS, Bae JM. Meta-analysis of diagnostic tests accuracy using STATA software. J Health Info Stat. 2015;40:190–199. (Korean)
-
- Moses LE, Shapiro D, Littenberg B. Combining independent studies of a diagnostic test into a summary ROC curve: data analytic approaches and some additional considerations. Stat Med. 1993;12:1293–1316. - PubMed
-
- Littenberg B, Moses LE. Estimating diagnostic accuracy from multiple conflicting reports: a new meta analytic method. Med Decis Making. 1993;13:313–321. - PubMed
MeSH terms
LinkOut - more resources
Full Text Sources
Medical