

SQUAT: a Sequencing Quality Assessment Tool for data quality assessments of genome assemblies
- PMID: 30999844
- PMCID: PMC7402383
- DOI: 10.1186/s12864-019-5445-3
SQUAT: a Sequencing Quality Assessment Tool for data quality assessments of genome assemblies
Abstract
Background: With the rapid increase in genome sequencing projects for non-model organisms, numerous genome assemblies are currently in progress or available as drafts, but not made available as satisfactory, usable genomes. Data quality assessment of genome assemblies is gaining importance not only for people who perform the assembly/re-assembly processes, but also for those who attempt to use assemblies as maps in downstream analyses. Recent studies of the quality control, quality evaluation/ assessment of genome assemblies have focused on either quality control of reads before assemblies or evaluation of the assemblies with respect to their contiguity and correctness. However, correctness assessment depends on a reference and is not applicable for de novo assembly projects. Hence, development of methods providing both post-assembly and pre-assembly quality assessment reports for examining the quality/correctness of de novo assemblies and the input reads is worth studying.
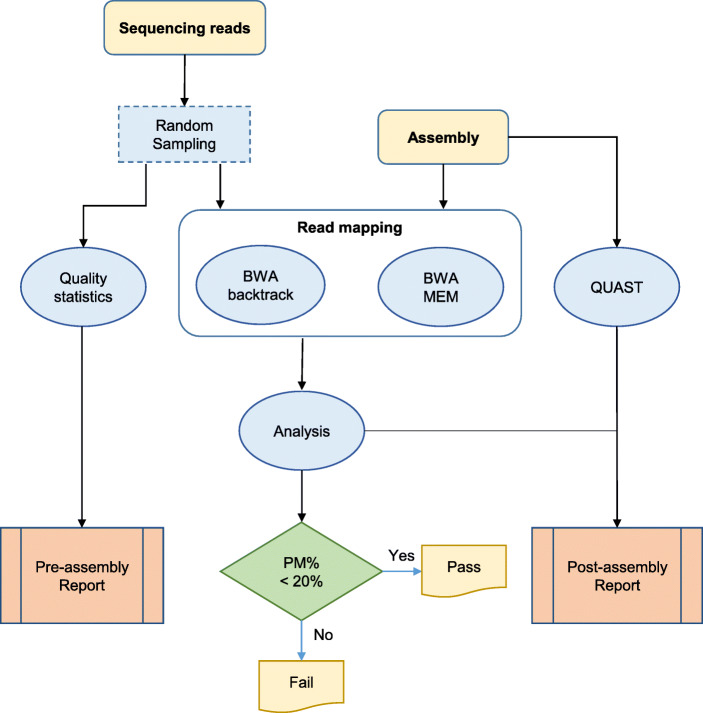
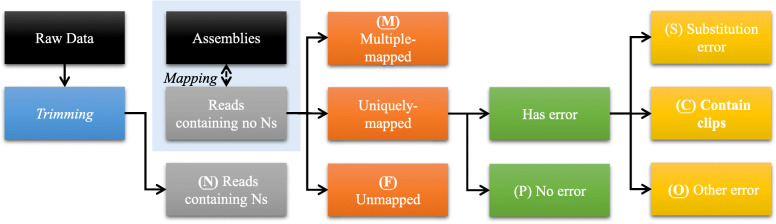
Results: We present SQUAT, an efficient tool for both pre-assembly and post-assembly quality assessment of de novo genome assemblies. The pre-assembly module of SQUAT computes quality statistics of reads and presents the analysis in a well-designed interface to visualize the distribution of high- and poor-quality reads in a portable HTML report. The post-assembly module of SQUAT provides read mapping analytics in an HTML format. We categorized reads into several groups including uniquely mapped reads, multiply mapped, unmapped reads; for uniquely mapped reads, we further categorized them into perfectly matched, with substitutions, containing clips, and the others. We carefully defined the poorly mapped (PM) reads into several groups to prevent the underestimation of unmapped reads; indeed, a high PM% would be a sign of a poor assembly that requires researchers' attention for further examination or improvements before using the assembly. Finally, we evaluate SQUAT with six datasets, including the genome assemblies for eel, worm, mushroom, and three bacteria. The results show that SQUAT reports provide useful information with details for assessing the quality of assemblies and reads.
Availability: The SQUAT software with links to both its docker image and the on-line manual is freely available at https://github.com/luke831215/SQUAT .
Keywords: Data quality assessment; Genome assembly; Genome sequencing; Non-model organisms.
Conflict of interest statement
None of the authors have any competing interests.
Figures


References
MeSH terms
Grants and funding
LinkOut - more resources
Full Text Sources
Other Literature Sources
