. 2019 Apr 18;20(1):302.
doi: 10.1186/s12864-019-5660-y.

Sequence imputation from low density single nucleotide polymorphism panel in a black poplar breeding population

Affiliations

Sequence imputation from low density single nucleotide polymorphism panel in a black poplar breeding population

Marie Pégard et al. BMC Genomics. .

Abstract

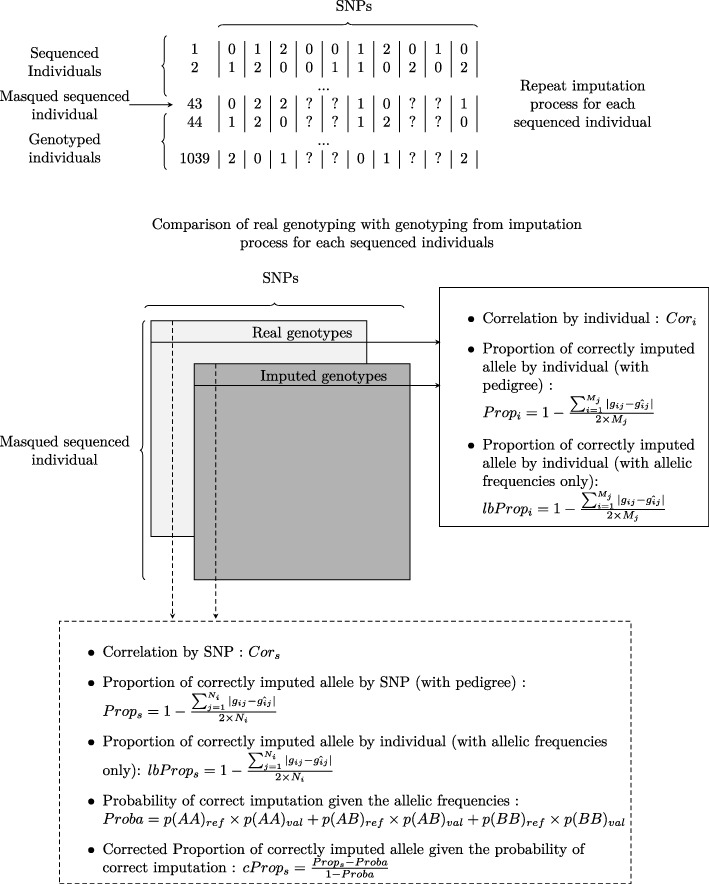
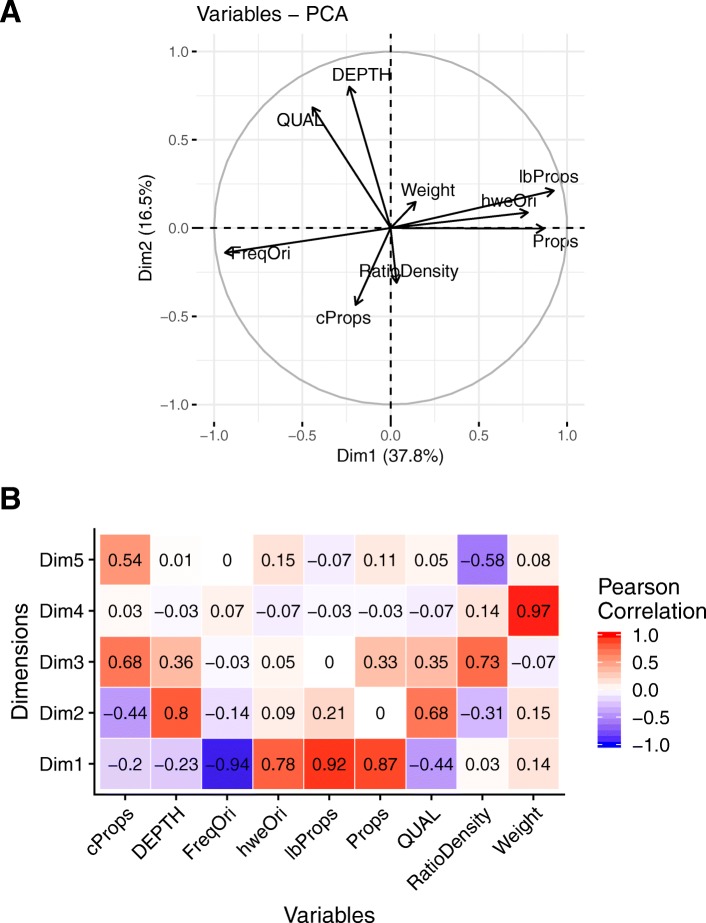
Background: Genomic selection accuracy increases with the use of high SNP (single nucleotide polymorphism) coverage. However, such gains in coverage come at high costs, preventing their prompt operational implementation by breeders. Low density panels imputed to higher densities offer a cheaper alternative during the first stages of genomic resources development. Our study is the first to explore the imputation in a tree species: black poplar. About 1000 pure-breed Populus nigra trees from a breeding population were selected and genotyped with a 12K custom Infinium Bead-Chip. Forty-three of those individuals corresponding to nodal trees in the pedigree were fully sequenced (reference), while the remaining majority (target) was imputed from 8K to 1.4 million SNPs using FImpute. Each SNP and individual was evaluated for imputation errors by leave-one-out cross validation in the training sample of 43 sequenced trees. Some summary statistics such as Hardy-Weinberg Equilibrium exact test p-value, quality of sequencing, depth of sequencing per site and per individual, minor allele frequency, marker density ratio or SNP information redundancy were calculated. Principal component and Boruta analyses were used on all these parameters to rank the factors affecting the quality of imputation. Additionally, we characterize the impact of the relatedness between reference population and target population.

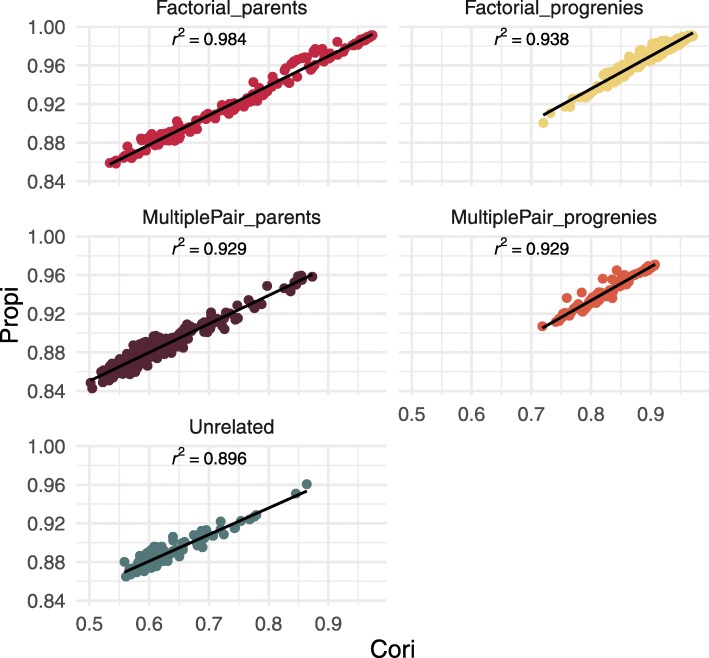
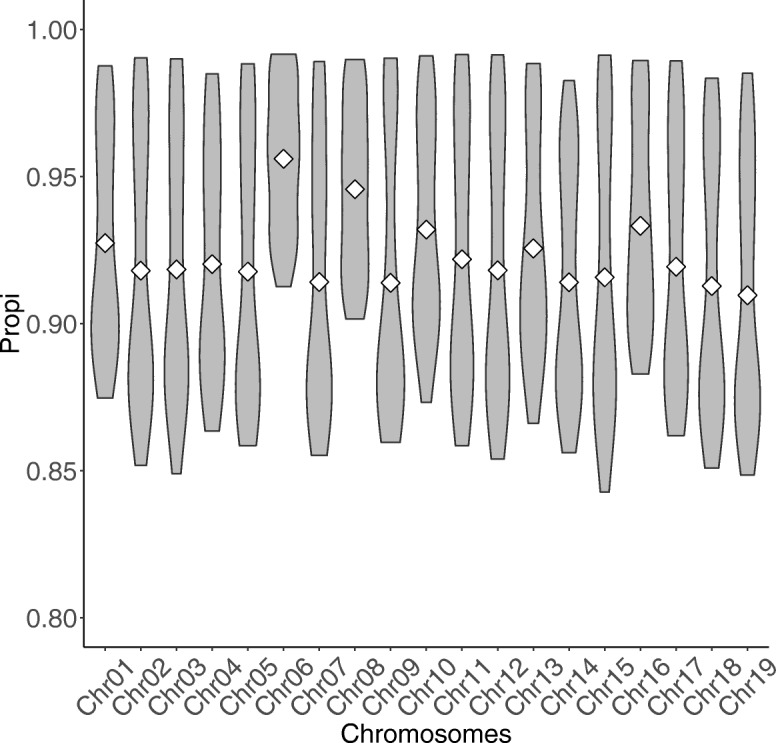
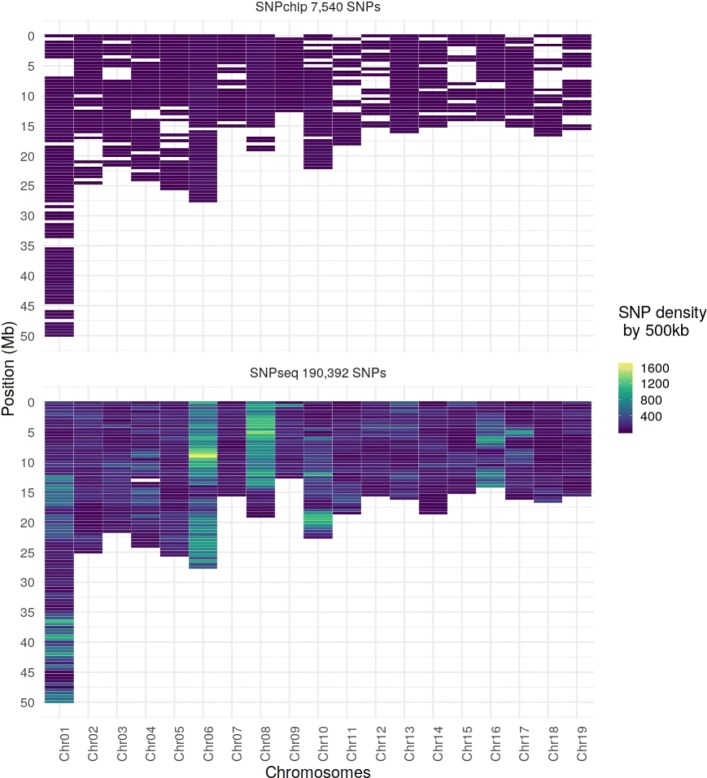
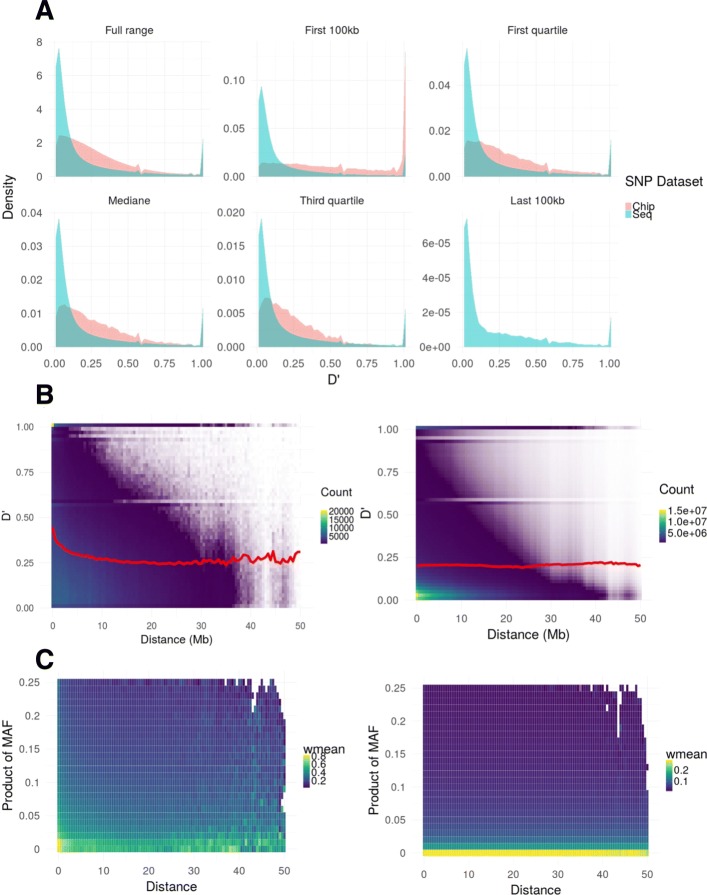
Results: During the imputation process, we used 7540 SNPs from the chip to impute 1,438,827 SNPs from sequences. At the individual level, imputation accuracy was high with a proportion of SNPs correctly imputed between 0.84 and 0.99. The variation in accuracies was mostly due to differences in relatedness between individuals. At a SNP level, the imputation quality depended on genotyped SNP density and on the original minor allele frequency. The imputation did not appear to result in an increase of linkage disequilibrium. The genotype densification not only brought a better distribution of markers all along the genome, but also we did not detect any substantial bias in annotation categories.

Conclusions: This study shows that it is possible to impute low-density marker panels to whole genome sequence with good accuracy under certain conditions that could be common to many breeding populations.

Keywords: Genotype Imputation; Low density arrays; Populus nigra; Whole-Genome Resequencing.


Conflict of interest statement

Ethics approval and consent to participate

Not applicable.

Consent for publication

Not applicable.

Competing interests

The authors declare that they have no competing interests.

Publisher’s Note

Springer Nature remains neutral with regard to jurisdictional claims in published maps and institutional affiliations.

Figures

Fig. 1
Fig. 1
Metrics for the assessment of imputation quality and accuracy by individuals and by SNPs. The first upper panel depicts an example of a toy genotyping matrix containing the allelic doses, with markers in columns and individuals in rows. First two individuals correspond to complete genotypes from sequences; next two to sequences with masked positions to be imputed for quality assessment; and last individual to one genotype from the SNP array. The lower panel represents the two simplified genotyping matrices respectively with real and imputed genotypes. Associated boxes contain the different metrics that were used in the study: to the right and across markers (columns), the metrics by individual; at the bottom and across individuals (rows), it can be found the metrics by marker. The expressions for Prop-like metrics contain the following variables: gij the observed allelic dosage (0,1,2) of the SNP i in individual j; ĝij the imputed allelic dosage (0,1,2) from FImpute; M the total number of SNP; Ni the number of individuals with called genotypes for SNP i; p(AA)refi, p(AB)refi, and p(BB)refi are the observed frequencies for genotypes AA, AB, and BB for SNP i in the reference and p(AA)vali, p(AB)vali, and p(BB)vali are the predicted genotypic frequencies in the testing population for SNP i
Fig. 2
Fig. 2
Comparaison of two imputation accuracy variables. Relationship between the proportion of alleles correctly imputed by each leave-one-out individual (Propi) and the Pearson’s correlation coefficient between true and imputed individual genotypes (Cori). The different panels correspond to the different individual classes in the mating regimes, and each point represents the values for one chromosome and one individual. The correlation value is given in each panel and derives from the fitted regression line
Fig. 3
Fig. 3
Proportion of individual correctly imputed by chromosomes. Distribution of the proportion of SNPs correctly imputed by chromosomes (Propi). White diamond symbol stands for the mean
Fig. 4
Fig. 4
Principal Component Analysis of Factors affecting SNP imputation. a Principal Component Analysis factor map of factors calculated at SNP level: Props: proportion of SNPs correctly imputed; cProps: proportion of SNPs correctly imputed and corrected by the minor allele frequency; lbProps: lower bound proportion of SNPs correctly imputed based only on allelic frequency; hweOri: p-value of a Hardy-Weinberg Equilibrium test for each site [47]; Weight: LD weight estimate obtained with the LDAK5 software; FreqOri: original allelic frequency in the sequenced individuals; QUAL: per-site SNP quality from the calling step; DEPTH: sequencing depth per site summed across all individuals ; RatioDensity: ratio between SNPchip density and SNPseq density in a 500kb window. b Correlations between parameters calculated at SNP level and dimension of the ACP from Fig. 3a
Fig. 5
Fig. 5
Comparaison of density marker before and after imputation. SNP density map before imputation (top panel), corresponding to the SNP chip genotyping, and after imputation from sequence (bottom) in 500 kb windows. SNPs were selected on two different criteria based on the percentage of alleles correctly imputed:Props (> 0.90) and cProps (> 0.80). The scale colour represents the density of markers, with dark blue for low density and yellow for high density
Fig. 6
Fig. 6
Comparaison of linkage disequilibrium before and after imputation. Distribution of D’ values of linkage disequilibrium for the two SNP sets in the study: SNPchip (pink) and SNPseq (blue) and over different ranges of physical distances (panel a). Panel b represents the distribution of D’ values versus distances in a heat-plot with low densities in blue and high densities in yellow, respectively for SNPchip (left) and SNPseq (right). The red line is the average value of D’ weighted by frequencies for a distance window of 500kb. Panel c represents the distribution of D’ values as a function of distances between any two positions and the product of the corresponding minor allele frequencies in the pair of loci, with colour indicating the average value of D’ weighted by frequencies for a distance window of 500kb from low range (blue) to high range (yellow), respectively for SNPchip (left) and SNPseq (right)

References

    1. Marchini Jonathan, Howie Bryan, Myers Simon, McVean Gil, Donnelly Peter. A new multipoint method for genome-wide association studies by imputation of genotypes. Nature Genetics. 2007;39(7):906–913. doi: 10.1038/ng2088. - DOI - PubMed
    1. Marchini Jonathan, Howie Bryan. Genotype imputation for genome-wide association studies. Nature Reviews Genetics. 2010;11(7):499–511. doi: 10.1038/nrg2796. - DOI - PubMed
    1. Burdick Joshua T, Chen Wei-Min, Abecasis Gonçalo R, Cheung Vivian G. In silico method for inferring genotypes in pedigrees. Nature Genetics. 2006;38(9):1002–1004. doi: 10.1038/ng1863. - DOI - PMC - PubMed
    1. Roshyara NR, Kirsten H, Horn K, Ahnert P, Scholz M. Impact of pre-imputation SNP-filtering on genotype imputation results. BMC Genet. 2014; 15(1):88. 10.1186/s12863-014-0088-5. - PMC - PubMed
    1. Berry D. P., McHugh N., Randles S., Wall E., McDermott K., Sargolzaei M., O’Brien A. C. Imputation of non-genotyped sheep from the genotypes of their mates and resulting progeny. animal. 2017;12(2):191–198. doi: 10.1017/S1751731117001653. - DOI - PubMed

LinkOut - more resources