

Development of an interactive web-based tool to conduct and interrogate meta-analysis of diagnostic test accuracy studies: MetaDTA
- PMID: 30999861
- PMCID: PMC6471890
- DOI: 10.1186/s12874-019-0724-x
Development of an interactive web-based tool to conduct and interrogate meta-analysis of diagnostic test accuracy studies: MetaDTA
Abstract
Background: Recommended statistical methods for meta-analysis of diagnostic test accuracy studies require relatively complex bivariate statistical models which can be a barrier for non-statisticians. A further barrier exists in the software options available for fitting such models. Software accessible to non-statisticians, such as RevMan, does not support the fitting of bivariate models thus users must seek statistical support to use R, Stata or SAS. Recent advances in web technologies make analysis tool creation much simpler than previously. As well as accessibility, online tools can allow tailored interactivity not found in other packages allowing multiple perspectives of data to be displayed and information to be tailored to the user's preference from a simple interface. We set out to: (i) Develop a freely available web-based "point and click" interactive tool which allows users to input their DTA study data and conduct meta-analyses for DTA reviews, including sensitivity analyses. (ii) Illustrate the features and benefits of the interactive application using an existing DTA meta-analysis for detecting dementia.
Methods: To create our online freely available interactive application we used the existing R packages lme4 and Shiny to analyse the data and create an interactive user interface respectively.
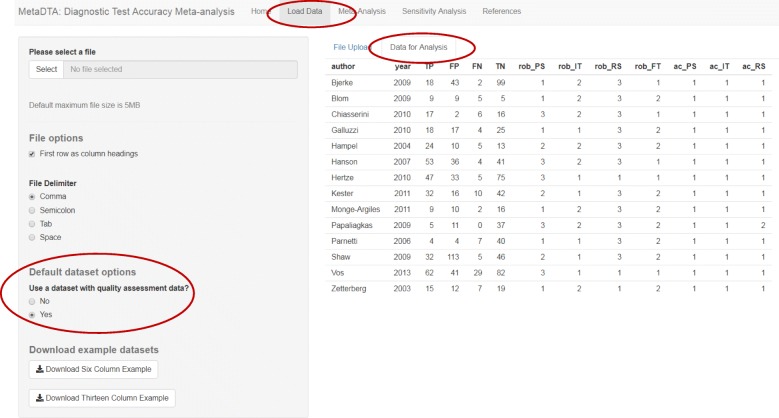
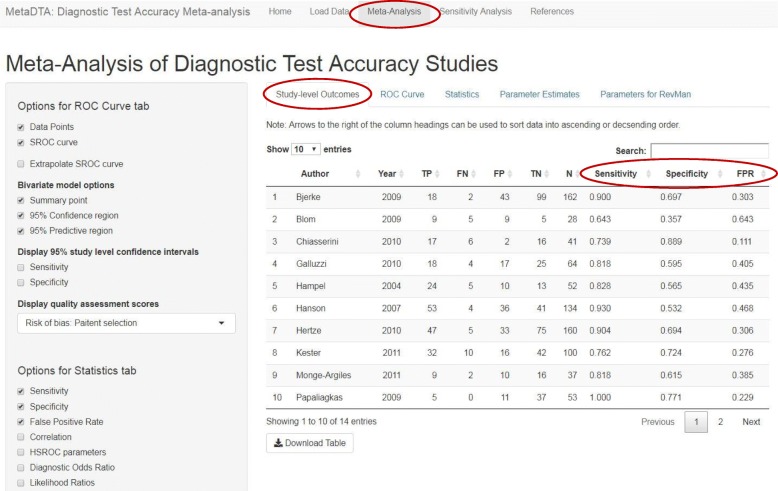
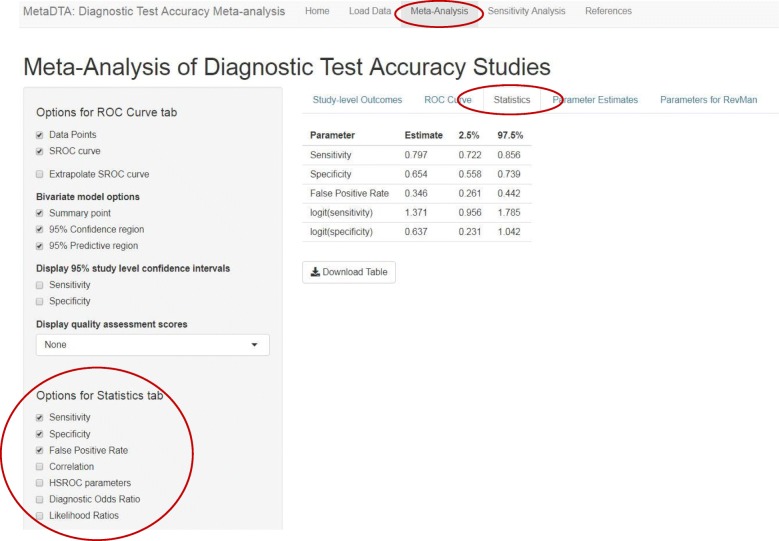
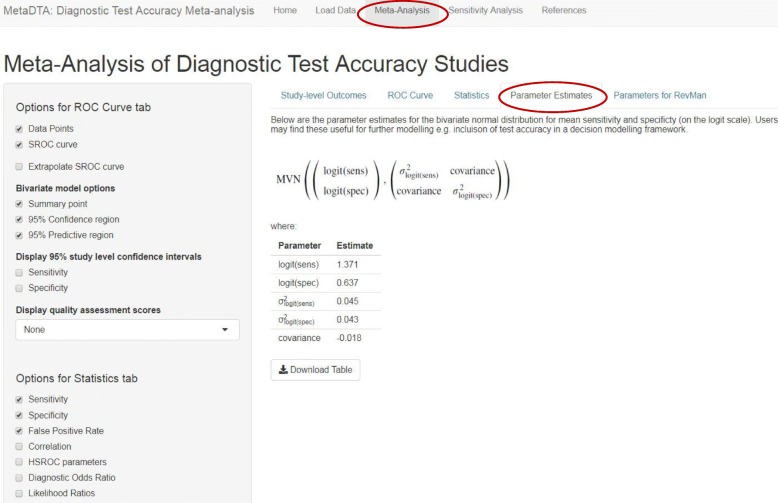
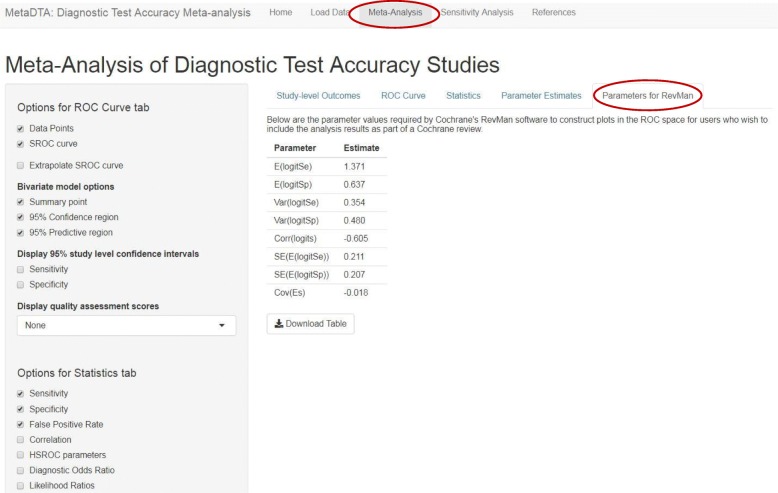
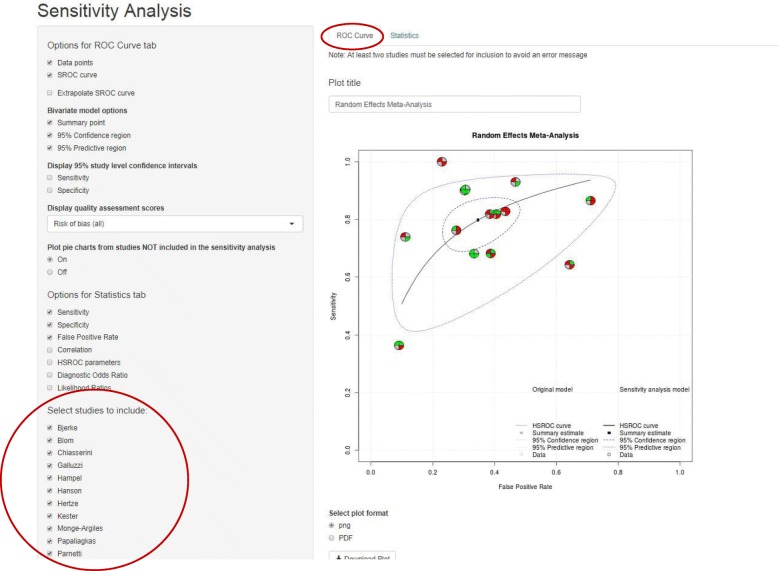
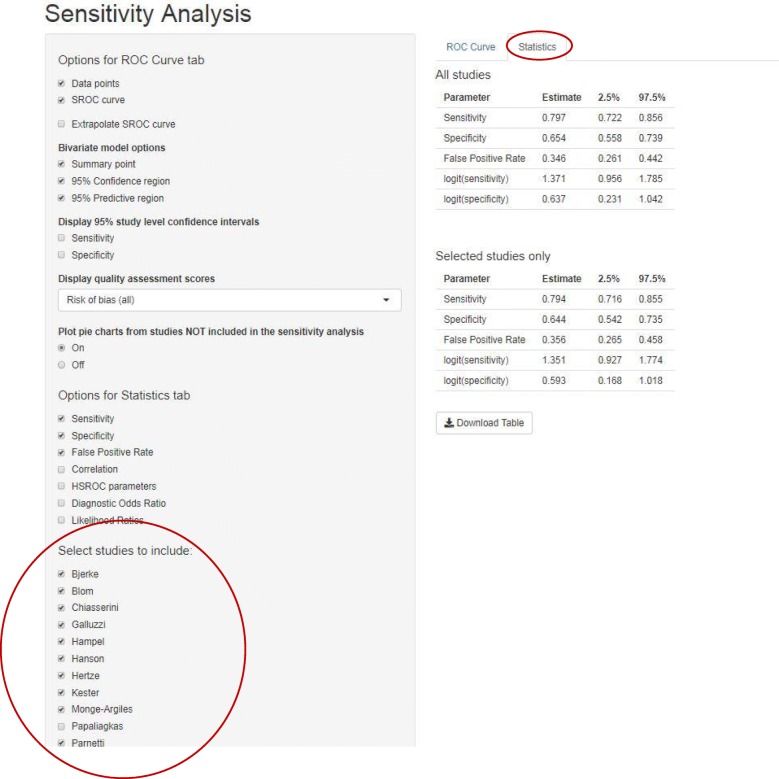
Results: MetaDTA, an interactive online application was created for conducting meta-analysis of DTA studies. The user interface was designed to be easy to navigate having different tabs for different functions. Features include the ability for users to enter their own data, customise plots, incorporate quality assessment results and quickly conduct sensitivity analyses. All plots produced can be exported as either .png or .pdf files to be included in report documents. All tables can be exported as .csv files.
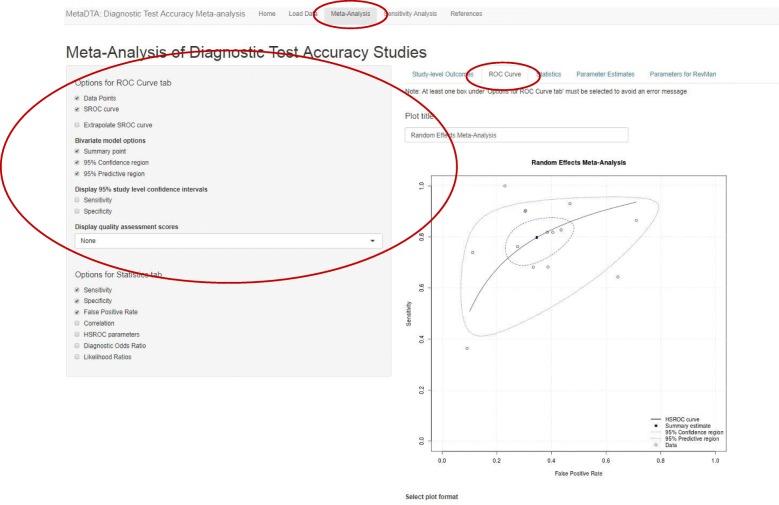
Conclusions: MetaDTA, is a freely available interactive online application which meta-analyses DTA studies, plots the summary ROC curve, incorporates quality assessment results and allows for sensitivity analyses to be conducted in a timely manner. Due to the rich feature-set and user-friendliness of the software it should appeal to a wide audience including those without specialist statistical knowledge. We encourage others to create similar applications for specialist analysis methods to encourage broader uptake which in-turn could improve research quality.
Keywords: Application; Diagnostic test accuracy; Meta-analysis.
Conflict of interest statement
Ethics approval and consent to participate
Not applicable.
Consent for publication
Not applicable.
Competing interests
The authors declare that they have no competing interests.
Publisher’s Note
Springer Nature remains neutral with regard to jurisdictional claims in published maps and institutional affiliations.
Figures
References
-
- Thompson M, Van den Bruel A. Diagnostic Tests Toolkit. Heneghan C, Perera R, Badenoch D, editors. Chichester, West Sussex, UK: Wiley-Blackwell; 2011.
-
- Murray S. In: Interactive data visualization for the web. Blanchette M, Demarest R, editors. Sebastopol: California: O'Reilly Media; 2013.
Publication types
MeSH terms
LinkOut - more resources
Full Text Sources
Medical
