. 2019 Apr 18;18(1):89.
doi: 10.1186/s12943-019-1017-z.

Ai-lncRNA EGOT enhancing autophagy sensitizes paclitaxel cytotoxicity via upregulation of ITPR1 expression by RNA-RNA and RNA-protein interactions in human cancer

Affiliations

Ai-lncRNA EGOT enhancing autophagy sensitizes paclitaxel cytotoxicity via upregulation of ITPR1 expression by RNA-RNA and RNA-protein interactions in human cancer

Shouping Xu et al. Mol Cancer. .

Abstract

Background: The biology function of antisense intronic long noncoding RNA (Ai-lncRNA) is still unknown. Meanwhile, cancer patients with paclitaxel resistance have limited therapeutic options in the clinic. However, the potential involvement of Ai-lncRNA in paclitaxel sensitivity remains unclear in human cancer.

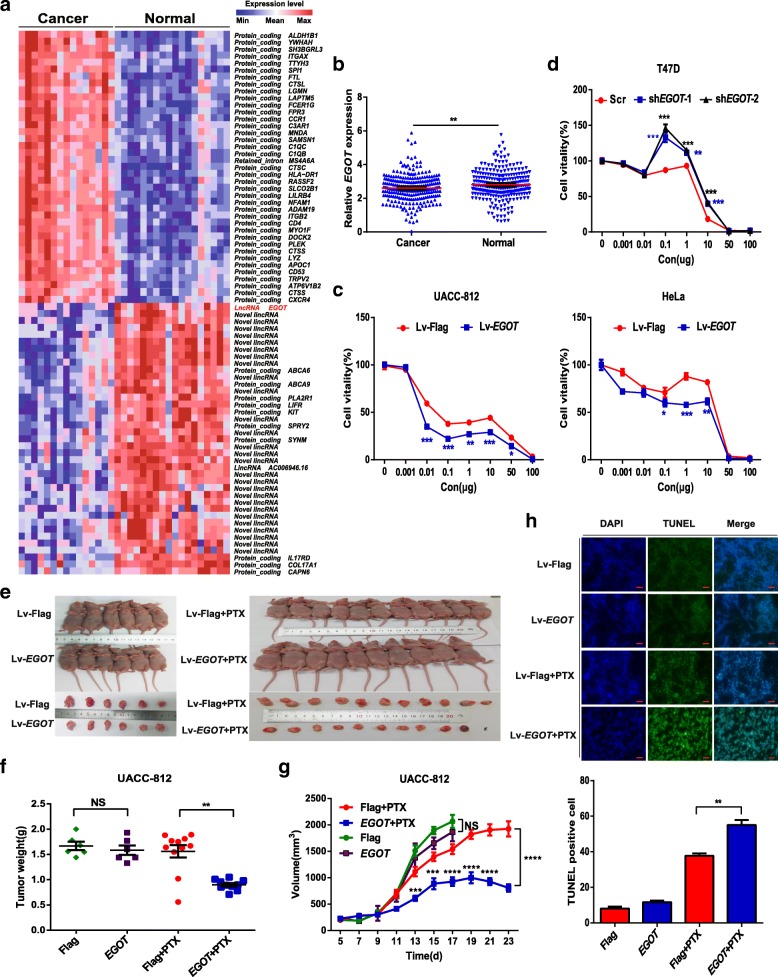
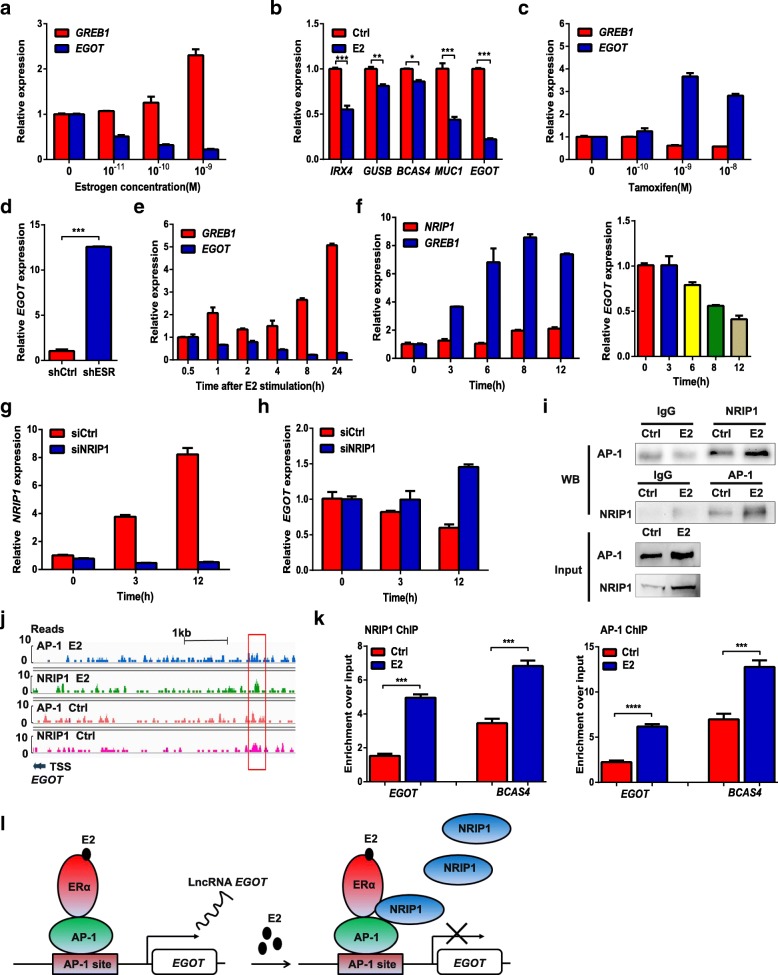
Methods: Whole transcriptome sequencing of 33 breast specimens was performed to identify Ai-lncRNA EGOT. Next, the role of EGOT in regulation of paclitaxel sensitivity was investigated. Moreover, the mechanism of EGOT enhancing autophagy sensitizes paclitaxel cytotoxicity via upregulation of ITPR1 expression by RNA-RNA and RNA-protein interactions was investigated in detail. Furthermore, upstream transcriptional regulation of EGOT expression was also investigated by co-immunoprecipitation and chromatin immunoprecipitation. Finally, clinical breast specimens in our cohort, TCGA and ICGC were applied to validate the role of EGOT in enhancing of paclitaxel sensitivity.

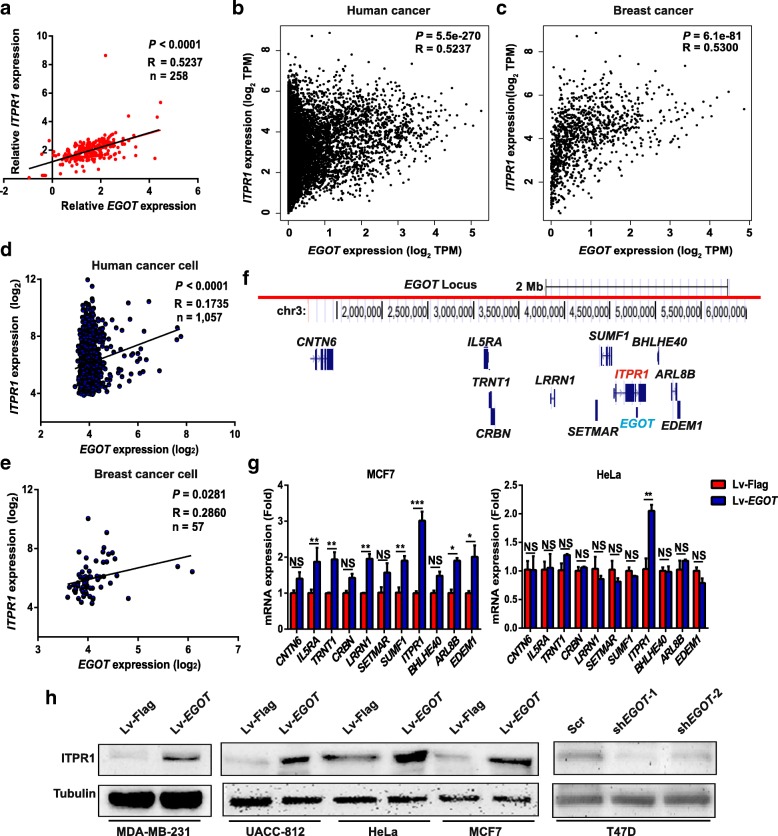
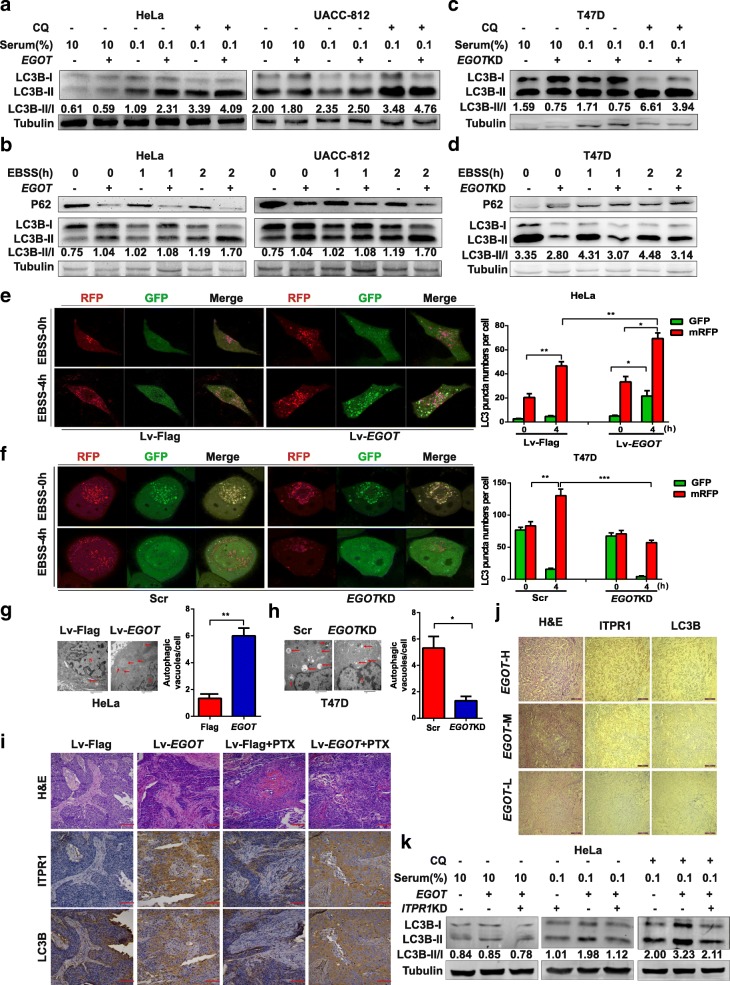
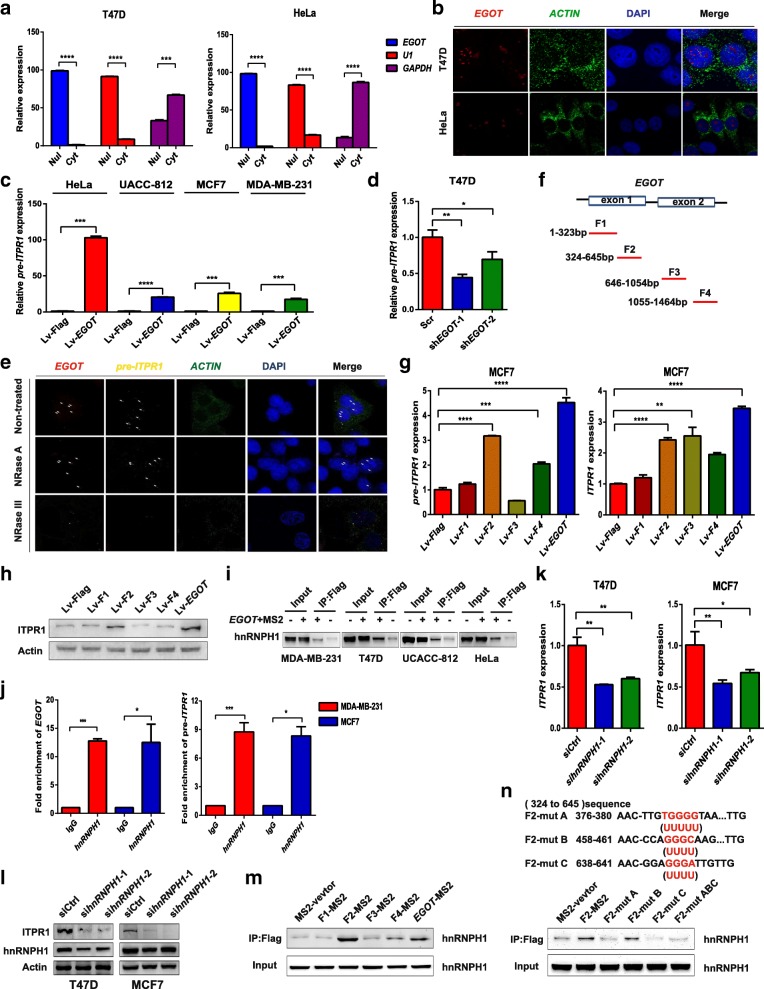
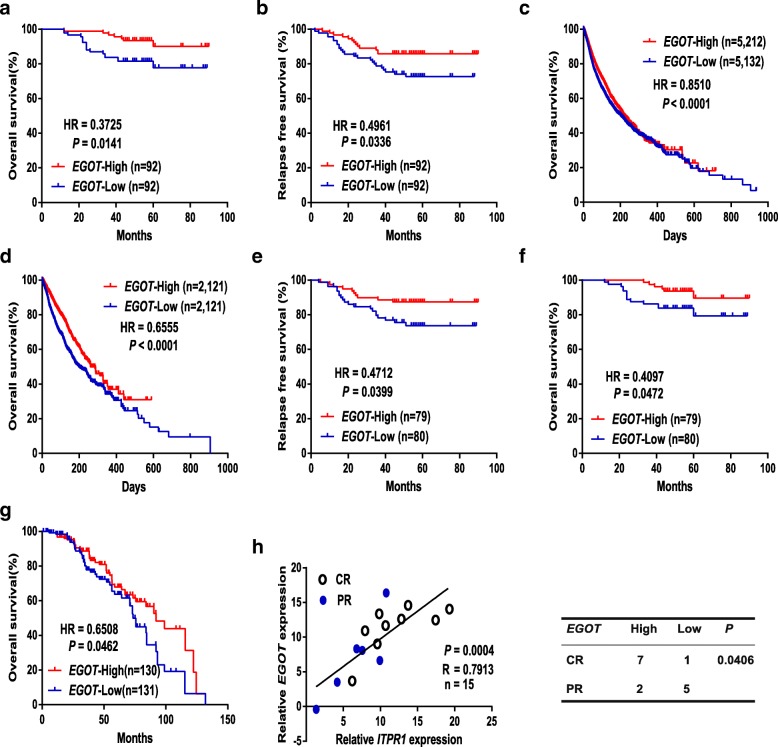
Results: EGOT enhances autophagosome accumulation via the up-regulation of ITPR1 expression, thereby sensitizing cells to paclitaxel toxicity. Mechanistically, on one hand, EGOT upregulates ITPR1 levels via formation of a pre-ITPR1/EGOT dsRNA that induces pre-ITPR1 accumulation to increase ITPR1 protein expression in cis. On the other hand, EGOT recruits hnRNPH1 to enhance the alternative splicing of pre-ITPR1 in trans via two binding motifs in EGOT segment 2 (324-645 nucleotides) in exon 1. Moreover, EGOT is transcriptionally regulated by stress conditions. Finally, EGOT expression enhances paclitaxel sensitivity via assessment of cancer specimens.

Conclusions: These findings broaden comprehensive understanding of the biology function of Ai-lncRNAs. Proper regulation of EGOT may be a novel synergistic strategy for enhancing paclitaxel sensitivity in cancer therapy.

Keywords: Ai-lncRNA; Autophagy; Cancer; EGOT; ITPR1; Paclitaxel.


Conflict of interest statement

Ethics approval and consent to participate

All patients consented to an institutional review board-approved protocol that allows comprehensive analysis of tumor samples (Ethics committee of Harbin Medical University). This study conforms to the Declaration of Helsinki.

Consent for publication

Written informed consent for publication was obtained from the patients. All authors have agreed to publish this manuscript.

Competing interests

The authors declare that they have no competing interests.

Publisher’s Note

Springer Nature remains neutral with regard to jurisdictional claims in published maps and institutional affiliations.

Figures

Fig. 1
Fig. 1
Ai-lncRNA EGOT enhances paclitaxel sensitivity in human cancer. a Heatmap of the whole transcriptomes of 33 breast specimens indicating that lncRNA EGOT expression levels are lower in cancer tissues than in normal tissues. Colors correspond to the expression level indicated by the log2-transformed scale bar below the matrix. Red and blue reflect Max and Min levels, respectively. b qRT-PCR analysis of EGOT expression in breast cancer tissues and adjacent normal tissues from 258 patients in the HMUCC cohort. GAPDH served as a reference for EGOT. c, d Cell viability was analyzed by CCK-8 assay after paclitaxel treatment for 48 h in EGOT overexpression and knockdown cells. e Mice and tumours from the UACC-812 Lv-EGOT and control (Lv-Flag) groups with or without treatment of paclitaxel. f The weight of tumours excised from mice in the UACC-812 Lv-EGOT and control groups with or without treatment of paclitaxel. g The volumes of tumours established in UACC-812 Lv-EGOT and control groups with or without 15 mg/kg paclitaxel once every four days at the indicated time (day 11, day 15 and day 19). h Representative sections (upper) and average number of TUNEL-positive cells (bottom) in subcutaneous tumors. Scale bar, 50 μm. Data are shown as the mean ± s.d. Student’s t-test was used for statistical analysis: * P < 0.05; ** P < 0.01; *** P < 0.001; and **** P < 0.0001. Data represent at least three independent experiments
Fig. 2
Fig. 2
EGOT expression is positively related to ITPR1 expression. a Correlation between EGOT and ITPR1 expression in 258 breast cancer tissues in the HMUCC cohort. EGOT and ITPR1 levels (normalized to GAPDH) were subjected to Pearson’s correlation analysis. b, c Correlation between EGOT and ITPR1 expression in 33 cancer types (n = 9664) (b) and in breast cancer (n = 1085) (c). Data were downloaded from the TCGA portal, and the expression levels of EGOT and ITPR1 are indicated by TPM values (log2). d, e Correlation between EGOT and ITPR1 expression in 1057 human cancer cell lines (d) and 57 breast cancer cell lines (e). Data were downloaded from the CCLE. EGOT and ITPR1 levels (normalized to GAPDH) were subjected to Pearson’s correlation analysis. f Schematic illustration of genes near the EGOT locus (less than 2 Mb). Location information was obtained from the UCSC Genome Browser (http://genome.ucsc.edu/cgi-bin/hgGateway). g Expression of nearby genes in MCF7 EGOT overexpression cells (left) and HeLa EGOT overexpression cells (right). Data are shown as the means ± s.d. Student’s t-test was applied for statistical analysis: * P < 0.05; ** P < 0.01; and *** P < 0.001. h Protein expression levels of ITPR1 in EGOT overexpression and knockdown cells. Data represent at least three independent experiments
Fig. 3
Fig. 3
EGOT induces autophagy to enhance paclitaxel sensitivity through ITPR1. a Western blot showing the effects of EGOT overexpression on LC3-II/LC3-I levels in HeLa (left) and UACC-812 cells (right) treated with CQ. b Western blot showing the effects of EGOT overexpression on LC3-II/LC3-I levels and P62 expression in HeLa (left) and UACC-812 cells (right) treated with EBSS. c Western blot showing the effects of EGOT overexpression on LC3-II/LC3-I levels in T47D cells treated with CQ. d Western blot showing the effects of EGOT overexpression on LC3-II/LC3-I levels and P62 expression in HeLa (left) and UACC-812 cells (right) treated with EBSS. e, f Confocal microscopy showing the effects of EBSS incubation on mRFP-GFP-LC3 distribution in HeLa EGOT overexpression cells (e) or T47D EGOT knockdown cells (f) 48 h after mRFP-GFP-LC3 adenovirus transfection (10,000× magnification). g, h Representative electron microscopy images and quantification of autophagic vacuoles in EGOT overexpression cells (g) and EGOT knockdown cells (h). Scale bar, 2 μm. Arrows depict autophagosomes, and the nucleus is denoted by N. i Representative hematoxylin and eosin (H&E), ITPR1, and LC3B staining of orthotopic xenograft sections from UACC-812 EGOT overexpression and control groups treated with or without paclitaxel. Scale bar, 400 μm. j Representative H&E, ITPR1 and LC3B staining in sections from 258 breast cancer tissues in HMUCC cohort. Scale bar, 200 μm. EGOT-H, EGOT-M, and EGOT-L represent high, medium, and low expression of EGOT, respectively. k Western blot showing LC3-II/LC3I levels in HeLa cells treated with CQ, different serum condition, EGOT overexpression or ITPR1 knockdown. Data are shown as the mean ± s.d. Student’s t-test was used for statistical analysis: * P < 0.05; ** P < 0.01; *** P < 0.001; and **** P < 0.0001. Data represent at least three independent experiments
Fig. 4
Fig. 4
EGOT regulates ITPR1 expression in cis and in trans in human cancer. a Nuclear and cytoplasmic fractions of HeLa and T47D cells were subjected to qRT-PCR. U1 is the nuclear (Nul) positive control; GAPDH is the cytoplasmic (Cyt) positive control. b RNA-FISH performed in HeLa and T47D cells. EGOT probes are red; ACTIN probes are green; and ACTIN served as the positive control (1000 × magnification). c, d Expression of pre-ITPR1 in EGOT overexpression and knockdown cells by qRT-PCR. e Combined RNase resistance and dual-RNA-FISH analysis. Before hybridization, T47D cells were treated with RNase A or RNase III. Hybridization was performed with specific probes against EGOT and ITPR1 transcripts. Nuclei are stained with DAPI. EGOT probes are red; ITPR1 probes are yellow; and ACTIN is the positive control. Arrows indicate foci (1000 × magnification). f Domain mapping of the EGOT transcript. g, h Expression of pre-ITPR1 and ITPR1 mRNA (g) and protein (h) in MCF7 cells transfected with different fragments of EGOT lentivirus. i An RNA pull-down assay was conducted using the Flag-MS2bp-MS2bs-based system followed by western blotting of lysates from MDA-MB-231, T47D, and UACC-812 cells after transfection with MS2-EGOT and MS2-vector (control). j Antibodies against hnRNPH1 were used for RIP, followed by qRT-PCR, in MCF7 and MDA-MB-231 cells. k, l ITPR1 mRNA expression was analyzed by qRT-PCR after hnRNPH1 knockdown via siRNAs (k), followed by western blotting (l). m The RNA pull-down assay was conducted using the Flag-MS2bp-MS2bs-based system in T47D cells after transfection with MS2-EGOT lentivirus along with different fragments of EGOT lentivirus, followed by western blotting. n Western blot of hnRNPH1 pulled down by F2-MS2 and mutated F2 RNA in 293 T cells. The red underlined sequences indicate the potential binding sites that were mutated into Us in F2, while the A, B and C binding sites were mutated at the same time to F2-mut ABC. Data are shown as the mean ± s.d. Student’s t-test was used for statistical analysis: * P < 0.05; ** P < 0.01; *** P < 0.001; and **** P < 0.0001. Data represent at least three independent experiments
Fig. 5
Fig. 5
EGOT expression is directly repressed by the NRIP1/AP-1 complex. a EGOT expression determined by qRT-PCR (normalized to GAPDH) in MCF7 cells treated with E2. b Expression of the estrogen-repressed genes, IRX4, GUSB, BCAS4, MUC1 and EGOT, determined by qRT-PCR in MCF7 cells treated with 1 nM E2 or ethanol (Ctrl) for 6 h. c EGOT expression determined by qRT-PCR in MCF7 cells treated with different doses of tamoxifen. d EGOT expression determined by qRT-PCR in MCF7 cells following ESR knockdown. e EGOT and GREB1 expression in MCF7 cells treated with 1 nM E2 stimulation at different time points. f NRIP1 mRNA and EGOT expression in MCF7 cells treated with 1 nM E2 stimulation at different time points. g, h Control siRNA (siCtrl) or siRNA against NRIP1 (siNRIP1) was transfected into MCF7 cells for 48 h, followed by 1 nM E2 stimulation. NRIP1 mRNA, GREB1, and EGOT levels were assessed after estrogen stimulation in the presence of siCtrl or siNRIP1. i Co-IP assays were conducted using anti-NRIP1 or anti-AP-1 antibodies for endogenous proteins in MCF7 cells treated with or without E2 stimulation. j Genome browser view of AP-1 and NRIP1 binding at the promoter of the EGOT locus. AP-1 and NRIP1 ChIP-seq was performed in MCF7 cells stimulated with ethanol (Ctrl) or E2. k ChIP-PCR showed the binding of AP-1 and NRIP1 to the EGOT promoter. The BCAS4 gene was utilized as a positive control. l Schematic illustration of NRIP1/AP-1 complex-mediated transcription suppression of EGOT expression. MCF7 cells were hormone starved for 3 days and further treated. In A, C, E, and F, GREB1 was used as an estrogen-inducible positive control gene. In B and D, data are shown as the mean ± s.d. Student’s t-test was used for statistical analysis: * P < 0.05; ** P < 0.01; and *** P < 0.001. Data represent at least three independent experiments
Fig. 6
Fig. 6
EGOT/ITPR1 expression is associated with a favorable prognosis and enhances paclitaxel sensitivity in human cancer. a, b Kaplan-Meier analyses of the relationships between EGOT expression and OS (a) or RFS (b) in breast cancer patients in the HMUCC cohort. c, d Kaplan-Meier analyses of the relationships between EGOT expression and OS among 33 cancer types in TCGA (c) and ICGC cohorts (d). e, f Kaplan-Meier analyses of the relationships between EGOT expression and OS (e) or RFS (f) in breast cancer patients treated with paclitaxel in the HMUCC cohort. g Kaplan-Meier analyses of the relationship between EGOT expression and OS in breast cancer patients treated with paclitaxel in the TCGA cohort. h The correlations between EGOT expression and ITPR1 mRNA expression were measured in 15 breast cancer patients treated with paclitaxel-containing adjuvant chemotherapy regimens (left). EGOT and ITPR1 levels (normalized to GAPDH) were subjected to Pearson’s correlation analysis. Correlations between EGOT expression and a pathological response were determined by the chi-square test (right). A complete pathological response is denoted by CR, while a partial response is denoted by PR. The median expression level was used as the cut-off value. Patients with EGOT expression values below the 50th percentile were classified as EGOT-Low. Patients with EGOT expression values above the 50th percentile were classified as EGOT-High

Similar articles

Cited by

References

    1. Yu Y, Gaillard S, Phillip JM, Huang TC, Pinto SM, Tessarollo NG, Zhang Z, Pandey A, Wirtz D, Ayhan A, et al. Inhibition of spleen tyrosine kinase potentiates paclitaxel-induced cytotoxicity in ovarian Cancer cells by stabilizing microtubules. Cancer Cell. 2015;28:82–96. doi: 10.1016/j.ccell.2015.05.009. - DOI - PMC - PubMed
    1. Luo Y, Li D, Ran J, Yan B, Chen J, Dong X, Liu Z, Liu R, Zhou J, Liu M. End-binding protein 1 stimulates paclitaxel sensitivity in breast cancer by promoting its actions toward microtubule assembly and stability. Protein Cell. 2014;5:469–479. doi: 10.1007/s13238-014-0053-0. - DOI - PMC - PubMed
    1. Mizushima N, Komatsu M. Autophagy: renovation of cells and tissues. Cell. 2011;147:728–741. doi: 10.1016/j.cell.2011.10.026. - DOI - PubMed
    1. Jeon YJ, Khelifa S, Ratnikov B, Scott DA, Feng Y, Parisi F, Ruller C, Lau E, Kim H, Brill LM, et al. Regulation of glutamine carrier proteins by RNF5 determines breast cancer response to ER stress-inducing chemotherapies. Cancer Cell. 2015;27:354–369. doi: 10.1016/j.ccell.2015.02.006. - DOI - PMC - PubMed
    1. Domenech E, Maestre C, Esteban-Martinez L, Partida D, Pascual R, Fernandez-Miranda G, Seco E, Campos-Olivas R, Perez M, Megias D, et al. AMPK and PFKFB3 mediate glycolysis and survival in response to mitophagy during mitotic arrest. Nat Cell Biol. 2015;17:1304–1316. doi: 10.1038/ncb3231. - DOI - PubMed

Publication types

MeSH terms

Substances