. 2019 May:43:32-42.
doi: 10.1016/j.ebiom.2019.03.038. Epub 2019 Apr 16.

Endothelial FAM3A positively regulates post-ischaemic angiogenesis

Affiliations

Endothelial FAM3A positively regulates post-ischaemic angiogenesis

Wenjing Xu et al. EBioMedicine. 2019 May.

Abstract

Background: Angiogenesis improves reperfusion to the ischaemic tissue after vascular obstruction. The underlying molecular mechanisms of post-ischaemic angiogenesis are not clear. FAM3A belongs to the family with sequence similarity 3 (FAM3) genes, but its biological function in endothelial cells in regards to vascular diseases is not well understood.

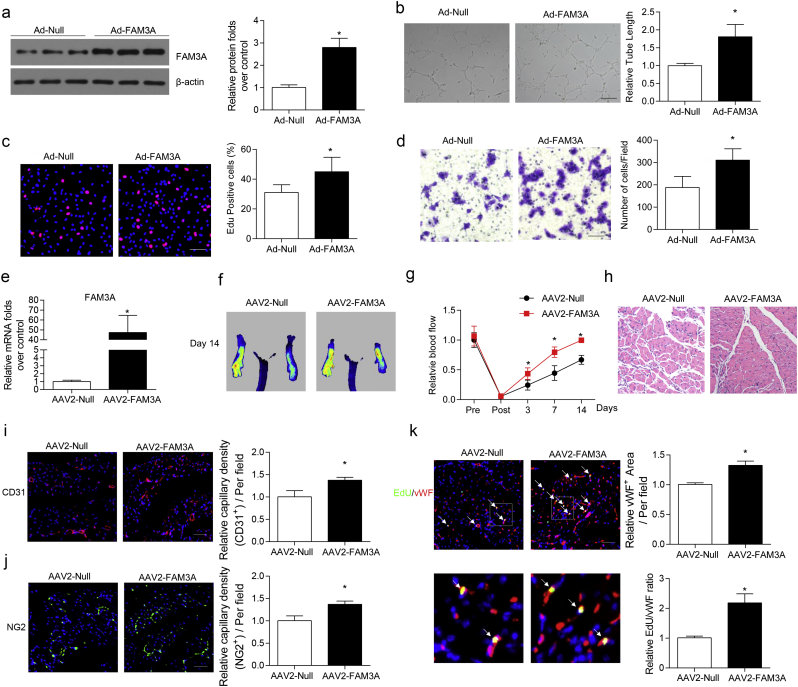
Methods: Gain- and loss-of-function methods by adenovirus or associated-adenovirus (AAV) in different models were applied to investigate the effects of FAM3A on endothelial angiogenesis. Endothelial angiogenesis was analysed by tube formation, migration and proliferation in vitro, and the blood flow and capillary density in a hind limb ischaemic model in vivo.

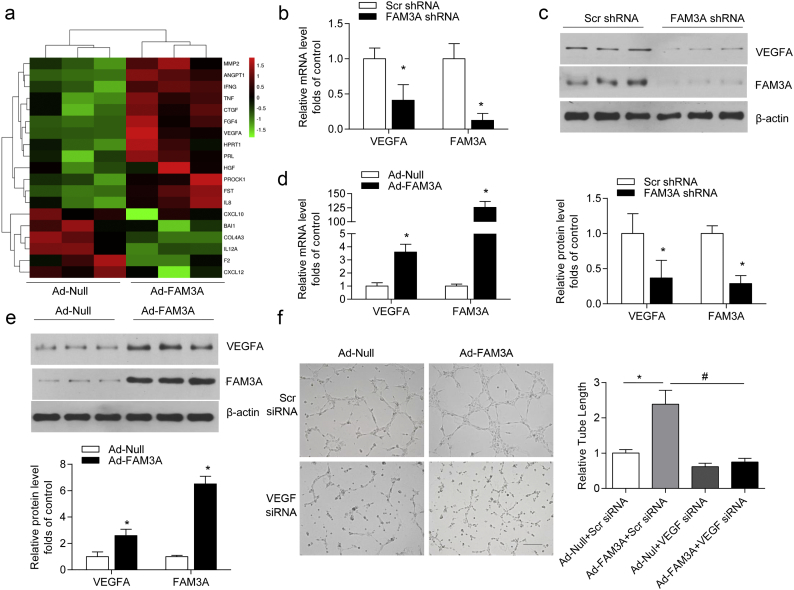
Findings: Endothelial FAM3A expression is downregulated under hypoxic conditions. Overexpression of FAM3A promotes, but depletion of FAM3A suppresses, endothelial tube formation, proliferation and migration. Utilizing the mouse hind limb ischaemia model, we also observe that FAM3A overexpression can improve blood perfusion and increase capillary density, whereas FAM3A knockdown has the opposite effects. Mechanistically, mitochondrial FAM3A increases adenosine triphosphate (ATP) production and secretion; ATP binds to P2 receptors and then upregulates cytosolic free Ca2+ levels. Increased intracellular Ca2+ levels enhance phosphorylation of the transcriptional factor cAMP response element binding protein (CREB) and its recruitment to the VEGFA promoter, thus activating VEGFA transcription and the final endothelial angiogenesis.

Interpretation: In summary, our data demonstrate that FAM3A positively regulates angiogenesis through activation of VEGFA transcription, suggesting that FAM3A may constitute a novel molecular therapeutic target for ischaemic vascular disease.

Keywords: ATP; Angiogenesis; CREB; FAM3A; Transcription; VEGF-A.


Figures

Fig. 1
Fig. 1
Hypoxia inhibits FAM3A expression in HUVECs. (a) HUVECs were cultured in normoxia (21% O2) or hypoxic (1% O2) conditions for 6 h, 12 h, 24 h, and FAM3A and HIF1α protein levels were detected by western blot assays. The densitometric analysis of FAM3A level was shown. (n = 5 per group) (b) The FAM3A mRNA level was detected via real-time PCR. (n = 5 per group) (c) HUVECs were treated with CoCl2 (200 μM) for 0 h, 6 h, 12 h, 24 h, and FAM3A and HIF1α protein levels were detected by western blot. (n = 5 per group) The densitometric analysis of FAM3A was shown. (d) The mRNA level of FAM3A expression was tested through real-time PCR. (n = 5 per group). Data were analysed with one-way ANOVA. Data are represented by mean ± S.D. *P < .05.
Fig. 2
Fig. 2
Endothelial FAM3A promotes endothelial angiogenesis. (a) HUVECs were infected with Ad-Null or Ad-FAM3A for 24 h, and the FAM3A protein level was measured by western blot. (b) Ad-Null- and Ad-FAM3A-infected HUVECs were placed in plates coated with Matrigel and tubular structures were photographed. (n = 5 per group) (c) The proliferation of Ad-Null- and Ad-FAM3A- infected HUVECs was measured by an EdU staining assay. (n = 5 per group) Scale bar, 50 μm. (d) The migration of Ad-Null- and Ad-FAM3A-infected HUVECs was measured by Transwell assays. (n = 5 per group) Scale bar, 25 μm (e) Endothelial cells from ischaemic adductor tissue were purified using a CD31/PECAM1 antibody and then subjected to real-time PCR assays to check the mRNA level of FAM3A. (f) The hind limb blood perfusion in the AAV2-Null or AAV2-FAM3A- transduced group were analysed by Laser Doppler imaging. Normal perfusion is indicated by Yellow, and a reduction in blood flow is indicated by Blue. (n = 8–10 per group). (g) The ischaemic: normal hind limb perfusion ratios in AAV2-Null- and AAV2-FAM3A-treated mice at different time were calculated to analysis blood perfusion. (h) H&E staining showed massive muscle degeneration in the ischemic regions. (i-k) The immunofluorescent staining of CD31, NG2 and EdU/vWF in the ischaemic gastrocnemius muscle was performed and quantitatively analysed (n = 5 per group). Scale bar, 50 μm. Data were analysed with two-tailed Student's t-tests (a-e, h-j) and two-way ANOVA (g). Data are represented by mean ± S.D. *P < .05. (For interpretation of the references to colour in this figure legend, the reader is referred to the web version of this article.)
Fig. 3
Fig. 3
Endothelial FAM3A knockdown suppresses angiogenesis. (a) HUVECs were infected with adenovirus coding Scr shRNA or FAM3A shRNA for 24 h, and the FAM3A protein level was measured by western blotting. (b) Ad-Scr shRNA- and Ad-FAM3A shRNA-infected HUVECs were placed in plates coated with Matrigel and tubular structures were photographed. (n = 5 per group) Scale bar, 50 μm. (c) The proliferation of HUVECs pre-infected with Ad-Scr shRNA or Ad-FAM3A shRNA was measured by an EdU staining assay. (n = 5 per group) Scale bar, 50 μm (d) The migration of HUVECs pre-infected with Ad-Scr shRNA or Ad-FAM3A shRNA was measured by Transwell assay. (n = 5 per group) Scale bar, 25 μm (e) Endothelial cells from ischaemic adductor tissue were purified using a CD31/PECAM1 antibody and then subjected to qRT-PCR assay to check the mRNA expression of FAM3A. (f) The hind limb blood perfusion in the AAV2-Scr shRNA- or AAV2-FAM3A shRNA-transduced group were analysed by Laser Doppler imaging. Normal perfusion is indicated by Yellow, and a reduction in blood flow is indicated by Blue. (n = 8–10 for each group) (g) The ischaemic: normal hind limb perfusion ratios in AAV2-Scr shRNA- or AAV2-FAM3A shRNA-treated mice at indicated time were collected to analysis blood perfusion. (h) H&E staining showed massive muscle degeneration in the ischemic regions. (i-k) The immunofluorescent staining of CD31, NG2 and EdU/vWF in the ischaemic gastrocnemius muscle was performed and quantitatively analysed. (n = 5 per group) Scale bar, 50 μm. Data were analysed with two-tailed Student's t-tests (a-e, h-j) and two-way ANOVA (g). Data are represented by mean ± S.D. *P < .05. (For interpretation of the references to colour in this figure legend, the reader is referred to the web version of this article.)
Fig. 4
Fig. 4
FAM3A regulates VEGFA expression. (a) Angiogenesis PCR array was performed in HUVECs that were infected with adenovirus containing FAM3A, and a heatmap of related gene expression levels is shown. Unsupervised hierarchical clustering analysis was performed using Ct values. Low expression is shown in green, and red indicates high expression. (n = 3 per group) (b-e) HUVECs were infected with adenovirus encoding Scr shRNA, FAM3A shRNA, Null and FAM3A. The VEGFA mRNA and protein levels in HUVECs were determined by real-time PCR (n = 5 per group) (b,d) and western blot assays (c, e). (f) HUVECs were first transfected with Scr siRNA or VEGF siRNA for 24 h and then placed in plates coated with Matrigel and tubular structures were photographed. (n = 5 per group) Scale bar, 50 μm. Data were analysed with two-tailed Student's t-tests (a-e) and one-way ANOVA (f). Data are represented by mean ± S.D. *P < .05. (For interpretation of the references to colour in this figure legend, the reader is referred to the web version of this article.)
Fig. 5
Fig. 5
FAM3A regulates cellular ATP level in HUVECs. (a) HUVECs were firstly infected with adenovirus containing Null or FAM3A for 24 h, and intracellular and extracellular ATP levels were measured by an ATP-Lite Assay Kit. (b) HUVECs were infected with Ad-Scr shRNA or Ad-FAM3A shRNA for 24 h, and cellular ATP levels as indicated were detected by an ATP-Lite Assay Kit. (c, d) HUVECs were infected with the indicated adenoviruses for 24 h. Oxygen consumption ratio (OCR) was measured using a Seahorse extracellular flux analyser. Basic respiration, ATP production and maximal respiration measurements in endothelial cells grown under indicated conditions were evaluated. (n = 4 per group). Data were analysed with two-tailed Student's t-tests. Data are represented by mean ± S.D. *P < .05.
Fig. 6
Fig. 6
CREB mediates the effect of FAM3A on VEGFA transcriptional activation. (a) Cartoon depiction of the promoter of VEGFA. The candidates for CREB binding sites in the VEGFA promoter are marked with black circles. For the VEGFA promoter reporter assays, HUVECs, pre-infected with adenovirus encoding Null or FAM3A, were transfected with the indicated plasmids, and luciferase activities were detected 48 h later. (n = 5 per group) (b) The interaction between CREB and the VEGFA promoter under FAM3A overexpression was performed by ChIP assays. (c, d) HUVECs were transfected with Scr siRNA or CREB siRNA for 24 h, and later infected with indicated adenoviruses for another 24 h. (n = 5 per group) (c) Western blot assays were applied to detect VEGFA and pCREB protein levels. (d) HUVECs were placed in plates coated with Matrigel, and tubular structures were photographed. Scale bar, 50 μm. Data were analysed with two-tailed Student's t-tests (a, b) and one-way ANOVA (c, d). Data are represented by mean ± S.D. *P < .05.
Fig. 7
Fig. 7
FAM3A regulates pCEBP and VEGFA via the ATP/P2 Receptor signalling pathway. (a–d) HUVECs, pre-infected with adenoviruses containing Null or FAM3A, were exposed with PPADS (50 μM). (a) Western blot assays were used to determine the expression of pCREB and VEGF. (b) The VEGF level in the supernatant of the HUVECs was determined by ELISA. (c) HUVECs were placed in plates coated with Matrigel, and tubular structures were photographed. Scale bar, 50 μm. (n = 5 per group) (d) The intracellular calcium level was determined by a calcium sensitive probe Fluo-8 AM. (e, f) HUVECs, pre-infected with indicated adenoviruses, were exposed with 2-APB (10 μM). (e) Western blot assays were used to determine the pCREB and VEGF protein levels. (f) The VEGF level in the cultured cell medium was tested by ELISA. (n = 5 per group). Data were analysed with one-way ANOVA. Data are represented by mean ± S.D. *P < .05.

Similar articles

Cited by

References

    1. Kolluru G.K., Bir S.C., Kevil C.G. Endothelial dysfunction and diabetes: effects on angiogenesis, vascular remodeling, and wound healing. Int J Vasc Med. 2012;2012 - PMC - PubMed
    1. Veith A.P., Henderson K., Spencer A., Sligar A.D., Baker A.B. Therapeutic strategies for enhancing angiogenesis in wound healing. Adv Drug Deliv Rev. 2018 - PMC - PubMed
    1. Niu G., Chen X. Vascular endothelial growth factor as an anti-angiogenic target for cancer therapy. Curr Drug Targets. 2010;11(8):1000–1017. - PMC - PubMed
    1. Hillen F., Griffioen A.W. Tumour vascularization: sprouting angiogenesis and beyond. Cancer Metastasis Rev. 2007;26(3–4):489–502. - PMC - PubMed
    1. De Bock K., Georgiadou M., Carmeliet P. Role of endothelial cell metabolism in vessel sprouting. Cell Metab. 2013;18(5):634–647. - PubMed

MeSH terms