

Cancer cells induce immune escape via glycocalyx changes controlled by the telomeric protein TRF2
- PMID: 31000523
- PMCID: PMC6545744
- DOI: 10.15252/embj.2018100012
Cancer cells induce immune escape via glycocalyx changes controlled by the telomeric protein TRF2
Abstract
Myeloid-derived suppressor cells (MDSCs) are immature myeloid cells with strong immunosuppressive activity that promote tumor growth. In this study, we describe a mechanism by which cancer cells control MDSCs in human cancers by upregulating TRF2, a protein required for telomere stability. Specifically, we showed that the TRF2 upregulation in cancer cells has extratelomeric roles in activating the expression of a network of genes involved in the biosynthesis of heparan sulfate proteoglycan, leading to profound changes in glycocalyx length and stiffness, as revealed by atomic force microscopy. This TRF2-dependent regulation facilitated the recruitment of MDSCs, their activation via the TLR2/MyD88/IL-6/STAT3 pathway leading to the inhibition of natural killer recruitment and cytotoxicity, and ultimately tumor progression and metastasis. The clinical relevance of these findings is supported by our analysis of cancer cohorts, which showed a correlation between high TRF2 expression and MDSC infiltration, which was inversely correlated with overall patient survival.
Keywords: HSPG; MDSC; NK cells; TRF2; immunosurveillance.
© 2019 The Authors.
Conflict of interest statement
The authors declare that they have no conflict of interest.
Figures
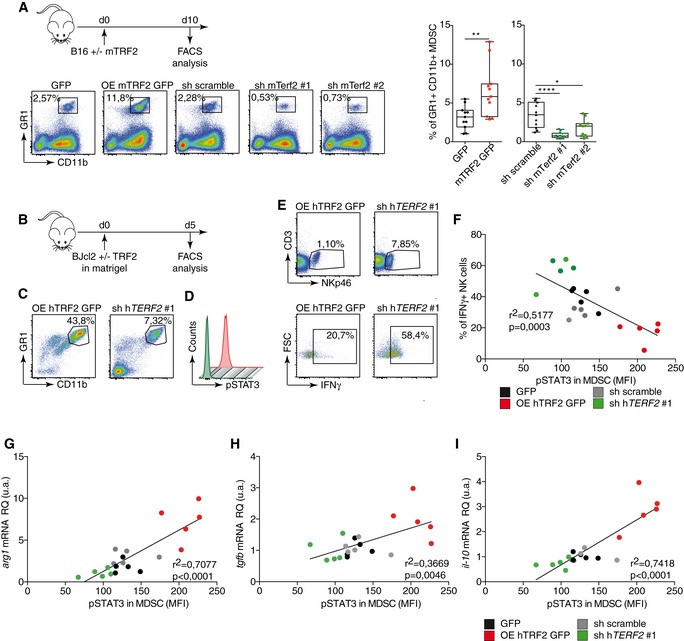
- A
B16F10 melanoma cells with either mTRF2 overexpression or knockdown were inoculated into the backs of immunocompetent mice. The percentages of intratumoral CD11bHi GR1Hi MDSCs (n = 10 mice), CD25+ Foxp3+ regulatory T cells (Tregs), or CD25+ Foxp3‐activated T cells (n = 5 mice per group) among CD45+ cells were analyzed by fluorescence‐activated cell sorting (FACS) and represented as box plots
- B–E
Schematic representation of the experiment (B). TRF2‐overexpressing or TRF2‐knockdown BJcl2 cells were inoculated into the backs of immunodeficient mice in the presence of Matrigel. Five days later, the percentage of immune cells infiltrating the Matrigel plugs of CD11bHi GR1Hi MDSCs (C), the intranuclear staining of pSTAT3 (D), and CD3− NKp46+ and IFN‐γ+ among CD3− NKp46+ NK cells (E) were determined by FACS (n = 5 mice per group).
- F–I
Linear correlation plot of the percentage of IFN‐ γ+ NK cells, the mean of fluorescence intensity (MFI) of pSTAT3 for MDSCs, and the expression of TRF2 (r 2 = 0.5177; Pearson's correlation, P = 0.003) (F); the mRNA expression level in the Matrigel plugs of arg1, pSTAT3 MFI, and TRF2 expression (r 2 = 0.7077; Pearson's correlation, P < 0.0001) (G); the mRNA expression level in the Matrigel plugs of tgfβ, pSTAT3 MFI, and TRF2 expression (r 2 = 0.3669; Pearson's correlation, P = 0.0046) (H) and the mRNA expression level in the Matrigel plugs of il‐10, pSTAT3 MFI, and TRF2 expression (r 2 = 0.7418; Pearson's correlation, P < 0.0001) (I).
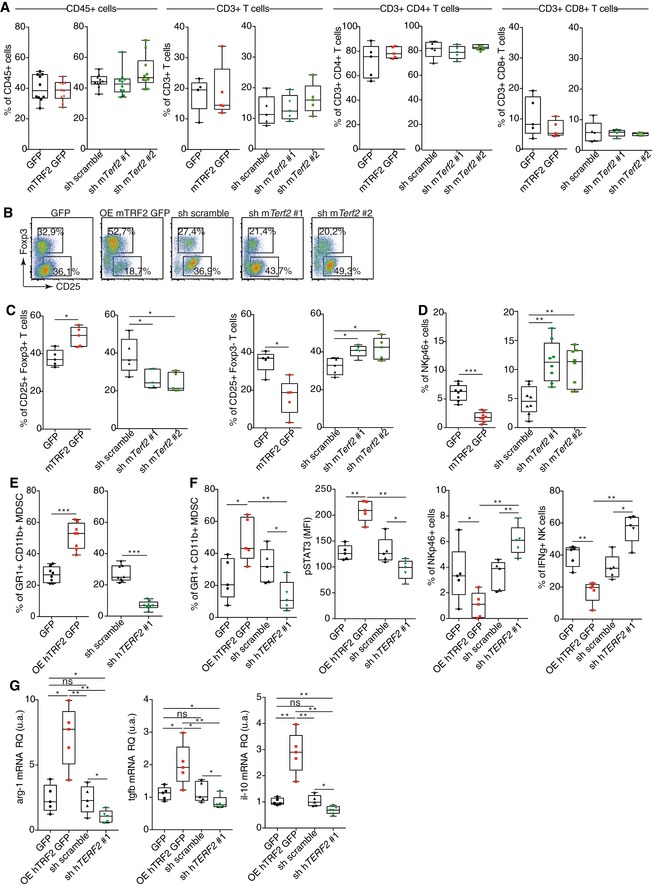
- A–D
Analysis of immune cell infiltration in TRF2‐overexpressing or TRF2‐knockdown B16F10 melanoma tumors. Box plots of total immune cell infiltration (CD45+ cells), total T cell infiltration (CD45+ CD3+ T cells), and CD8+ or CD4+ T cells among CD3+ cells infiltrating (A). Representative density plot of regulatory T cells (CD25+ Foxp3+ Treg) and activated T cells (CD25+ Foxp3−) (B). Box plots of infiltrating Treg (CD25+ Foxp3+) and activated T cells (CD25+ Foxp3−) (C) or NK cells (NKp46+ CD3−) (D).
- E
Analysis of MDSC infiltration in TRF2‐overexpressing or TRF2‐knockdown BJcl2 tumors in Nude mice.
- F, G
Data used for the correlation analysis presented in Fig 1F–I. Box plots present the percentages of CD11bHi GR1Hi MDSCs among CD45+ cells infiltrating the Matrigel plug, the mean fluorescence intensity (MFI) of intranuclear pSTAT3 staining in MDSCs, the percentages of intratumoral CD3− NKp46+ NK cells among CD45+ cells, and NKp46+ IFN‐γ+ NK cells (F). The mRNA expression level (relative quantity) in the Matrigel plugs of arg1, tgfβ, and il‐10.
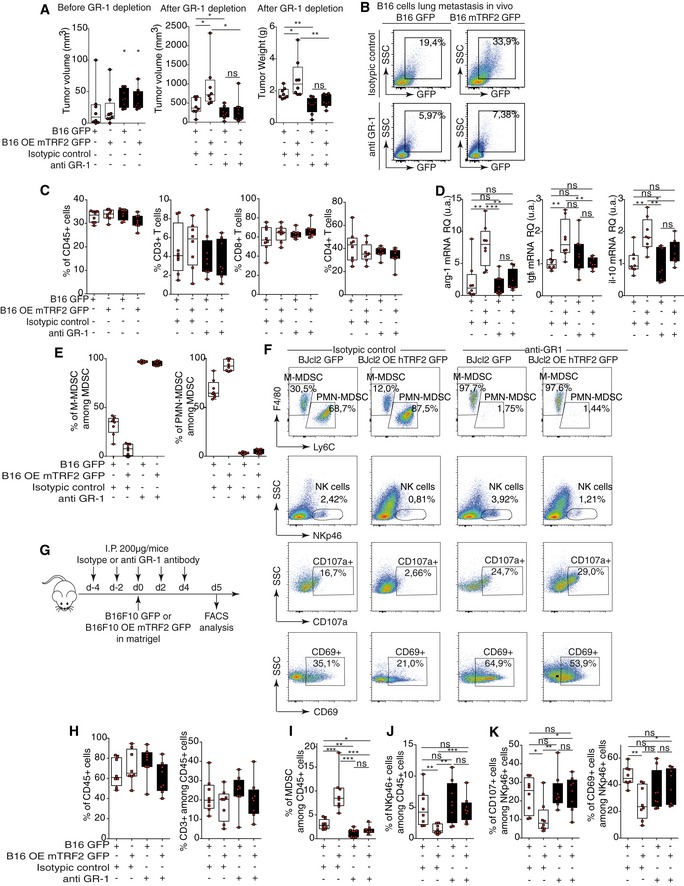
- A
B16F10 tumor volumes before (left panel) and tumor volume and weight after anti‐GR1 depletion (right panel).
- B
B16F10 GFP+ metastasis infiltrating lung from subcutaneous tumor‐bearing mice (from panel A) after anti‐GR1 depletion.
- C
Total immune cell infiltration (CD45+ cells), total T cell infiltration (CD45+ CD3+ T cells), and CD8+ or CD4+ T cells among CD3+ cells in TRF2‐overexpressing or TRF2‐knockdown B16F10 tumors treated with or without the anti‐GR1 antibody (from panel A).
- D
The mRNA expression level (relative quantity) in the tumors of arg1, tgfβ, and il‐10.
- E
PMN‐MDSCs and M‐MDSCs distribution among total intratumoral MDSCs in B16F10 TRF2‐overexpressing tumors after anti‐GR1 depletion.
- F
Density plot of infiltrating M‐MDSCs, PMN‐MDSCs, total NK cells, and CD107a+ or CD69+ NK cells in control or anti‐GR1‐treated Matrigel plugs generated with BJcl2 cells.
- G–K
Matrigel plug assay using B16F10 cells in anti‐GR1 treated animals (G). Total immune cell infiltration (CD45+ cells) (H), total T cell infiltration (H), MDSCs (I), total NK cells (J), and activated NK cells (K).
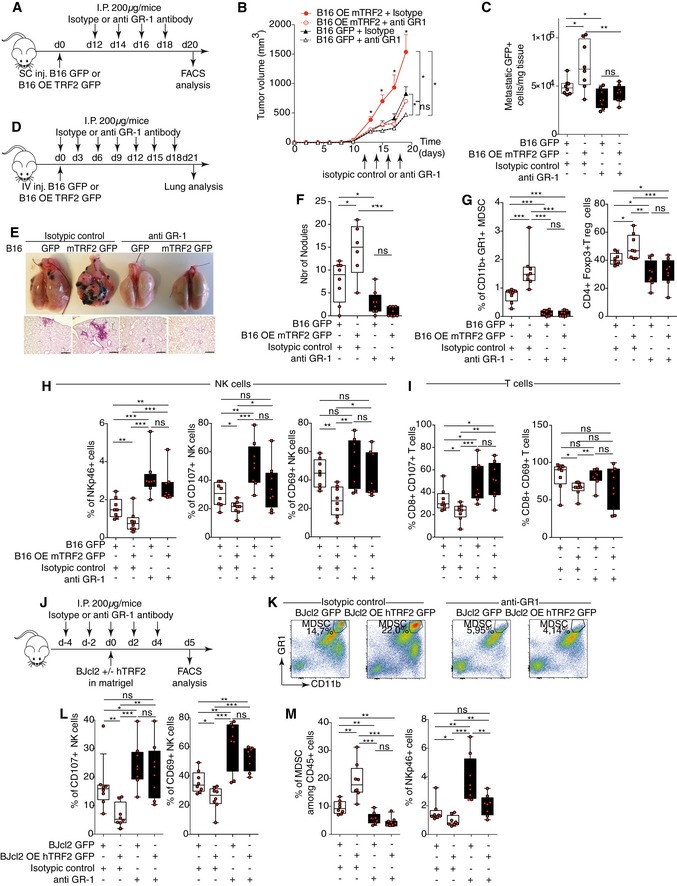
- A–C
B16F10 melanoma cells with or without mTRF2 overexpression were inoculated into the backs of immunocompetent mice and treated with anti‐GR1 antibody or isotypic control (200 μg/IP). The tumor volume was determined every 2 days using hemi‐ellipsoid formula (B). On day 19 of the tumor growth experiment, the percentages of GFP+ cells infiltrating the lungs were determined by FACS and presented as the number of GFP+ cells/mg lung tissue (C).
- D–F
B16F10 melanoma cells with or without mTRF2 overexpression were inoculated into tail vein of immunocompetent mice and treated with anti‐GR1 antibody or isotypic control (200 μg/IP) every 3 days. On day 21, lung metastasis was analyzed by counting macroscopic metastatic nodules and hematoxylin and eosin (H&E) staining (E and F), scale bars = 500 μm.
- G–I
Tumor‐infiltrating immune cells from tumors of the experiment shown in (A) were analyzed by FACS: MDSCs and CD25+ Foxp3+ Tregs (G), NK cells (H), and CD8+ T cells (I).
- J–M
BJcl2 cells with or without hTRF2 overexpression were inoculated into the backs of immunodeficient nude mice and treated with anti‐GR1 antibody or isotypic control (200 μg/IP) as indicated in (J) and NK cells recruitment, degranulation, and MDSC infiltration were monitored by FACS (K‐M). Density plot of CD11bHi GR1Hi MDSC staining in control or anti‐GR1‐treated Matrigel plugs (K). Box plots of the percentages of infiltrating or activated NK cells (CD107a or CD69) (L), of CD11bHi GR1Hi MDSC or NKp46+ NK cells (M) infiltrating the Matrigel plugs assay among the CD45+ cells.
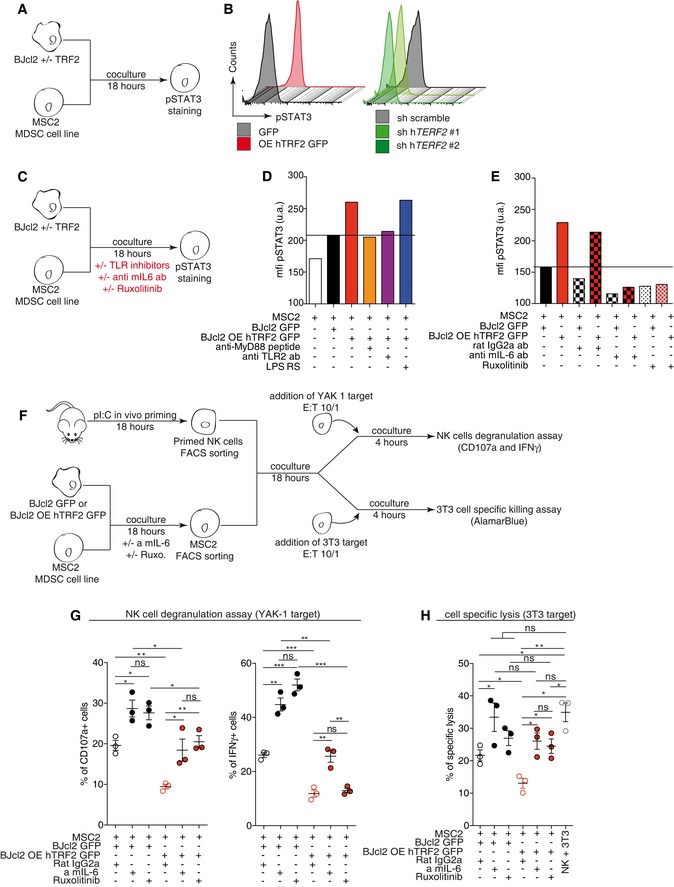
- A, B
Analysis of STAT3 phosphorylation by MSC2 cells after 18 h co‐culture with BJcl2 overexpressing or compromised for TRF2 (A). Histograms of the pSTAT3 mean fluorescence intensity (MFI) (B).
- C–E
Same experiment as in (A, B) ± inhibitors: anti‐MyD88 peptide inhibitor, anti‐mouse TLR2 antibody, or lipopolysaccharide (LPS)‐RS, an antagonist of TLR4 in (D) and anti‐mouse IL‐6 or JAK1/2 inhibitor (Ruxolitinib) in (E).
- F–H
Schematic representation of the MDSC suppression assay (F). TRF2‐overexpressing or TRF2‐knockdown BJcl2 cells were co‐cultured with MSC2 cells for 18 h ± mouse IL‐6 blocking antibody or ruxolitinib. After FACS sorting, MSC2 cells were co‐cultured for 18 h with primed and purified NK cells before a 4 h challenge with YAK‐1. NK cell degranulation and IFN‐γ production were analyzed by FACS (G). Alternatively, a 4 h challenge with NIH3T3 cells was performed and the ability of NK cells to kill NIH3T3 cells were determined by colorimetric analysis (AlamarBlue) (H).
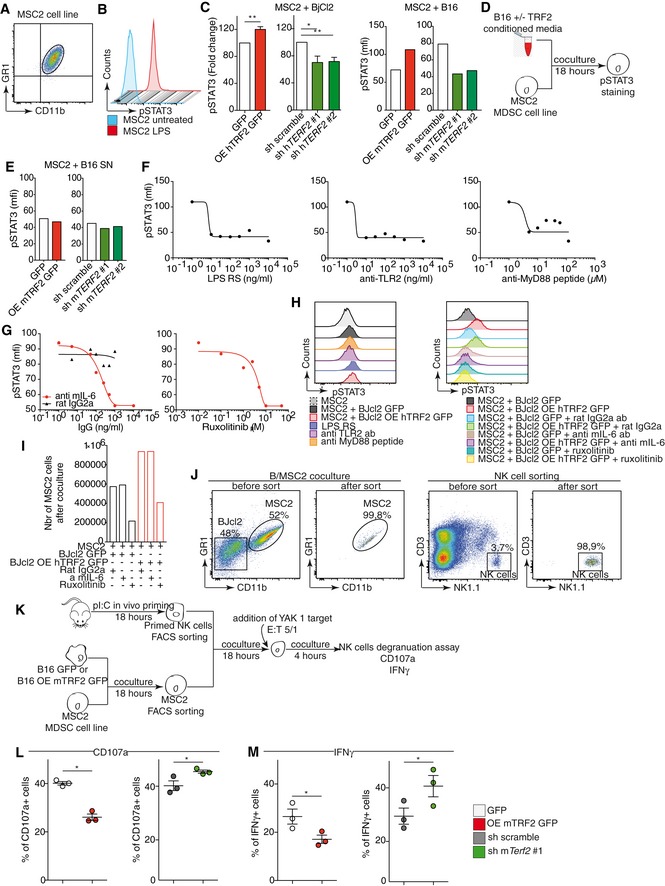
- A
Density plot of CD11b GR1 staining in MSC2 cells.
- B
MSC2 cells were activated with 1 μM lipopolysaccharide (LPS), and pSTAT3 levels were determined 18 h after stimulation by FACS.
- C
STAT3 phosphorylation by MSC2 cells after co‐culture with BJcl2 (left panel) or B16F10 cells (right panel) overexpressing or knockdown for terf2.
- D, E
STAT3 phosphorylation by MSC2 cells after co‐culture with conditioned media from BJcl2 (left panel) or B16F10 (right panel) overexpressing or knockdown for terf2.
- F, G
Dose–response analysis of pSTAT3 levels in MSC2 cells after treatment with various doses of the TLR4 antagonist LPS‐RS, anti‐mouse TLR2 antibody, or anti‐MyD88 peptide (F) or with various doses of anti‐mouse IL‐6 antibody or JAK1/2 inhibitor (G).
- H
Histograms of the pSTAT3 MFIs depending on the concentration of the molecule.
- I
MSC2 cell number after 18 h of co‐culture with BJcl2 cells ± anti‐mouse IL‐6 antibody or JAK1/2 inhibitor.
- J
Representative density plot to assessed purity control for MSC2 sorting from the co‐culture or NK cell sorting from splenocytes.
- K–M
Schematic representation of the MDSC suppression assay (K). TRF2‐overexpressing or TRF2‐knockdown B16F10 cells were co‐cultured with MSC2 cells for 18 h. After FACS sorting, MSC2 cells were co‐cultured for 18 h with primed and purified NK cells before a 4 h challenge with YAK‐1 E/T ratio of 5:1. NK cell degranulation (L) and IFN‐γ production (M) were analyzed by FACS.
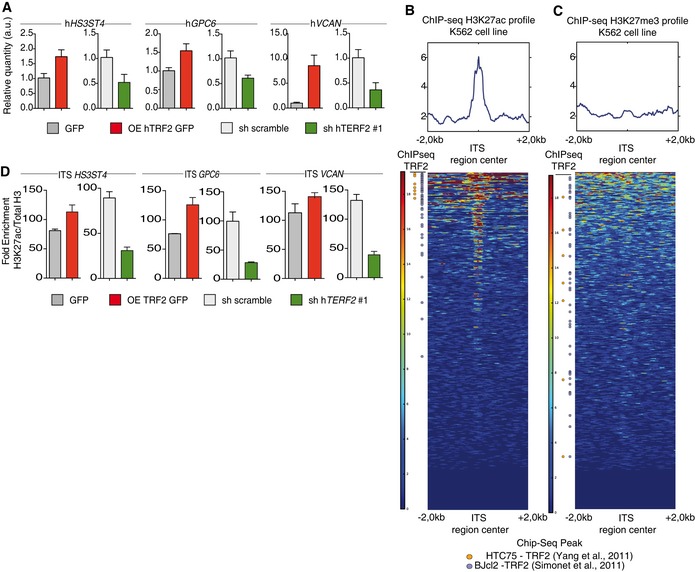
- A
Gene expression analysis by quantitative polymerase chain reaction (qPCR) of TRF2 target genes following TRF2 overexpression or knockdown.
- B, C
Heatmap of H3K27ac (B) or H3K23me3 (C) peaks on the 4 kilobase (Kb) region around genomic ITSs (ENCODE data for the K562 cell line). The mean intensity of the region is depicted in the histograms. ITSs are clustered depending of the peak mean intensity obtained from H3K27ac or H3K27me3 chromatin immunoprecipitation sequencing (ChIP‐seq) of the 4 Kb region. ITSs detected by ChIP‐seq using an anti‐TRF2 antibody are shown on the left.
- D
Specific qPCR for HS3SH4, GPC6, and VCAN ITSs after ChIP using an anti‐H3K27ac antibody in TRF2‐overexpressing or TRF2‐knockdown BJcl2 cells. Data represent fold enrichment of the H3K27ac level compared with the total H3 level.
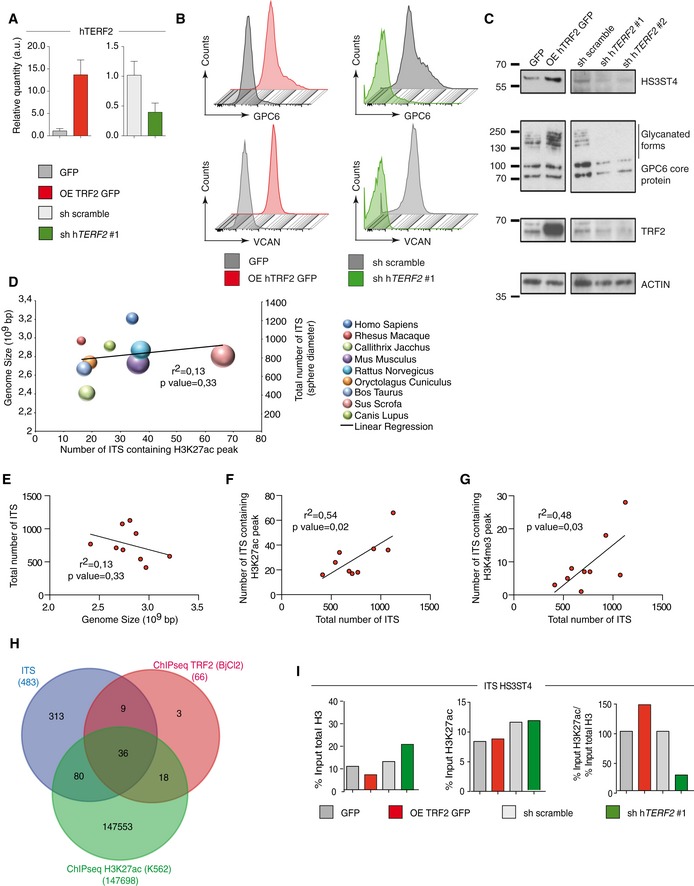
- A
qPCR analysis of TRF2 expression in BJcl2 cells in which TRF2 target gene expression was determined in Fig 4A and D.
- B
FACS analysis of GPC6 and VCAN expression in BJcl2 cells overexpressing or compromised for TRF2
- C
Western blot analysis of HS3ST4, GPC6, and VCAN expression in BJcl2 cells overexpressing or compromised for TRF2
- D
Analysis of the correlation among the genome size (y‐axis), total number of ITSs (z‐axis corresponding to sphere diameter), and number of ITSs containing H3K27ac peaks (x‐axis).
- E–G
Correlation between genome size and total number of ITSs (D), between total number of ITSs and number of ITSs containing H3K27ac peaks (F), and between total number of ITSs and number of ITSs containing H3K4me3 peaks (G)
- H
Venn diagram of genes identified by TRF2 chromatin immunoprecipitation sequencing (ChIP‐seq; red), genes bearing ITSs (blue), and all H3K27ac peaks (green).
- I
Histograms of the percentage input of total H3 or input of H3K27ac used for immunoprecipitation or the ratio of the percentage input of total H3 to that of H3K27ac used for immunoprecipitation for the HS3ST4 ITS.
- A
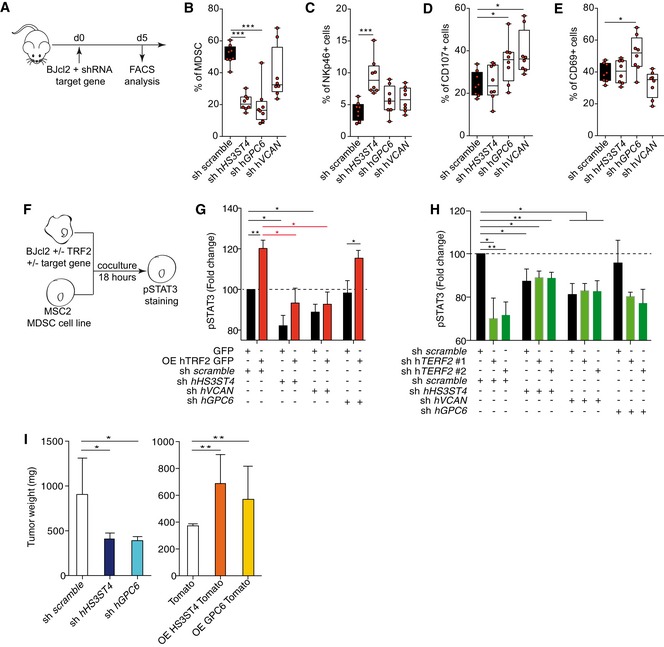
Schematic representation of the Matrigel plug assay with BJcl2 cells knockdown for TRF2 target genes. Immune cell infiltration within the Matrigel plugs was determined by FACS.
- B–E
Percentage of CD11bHi GR1Hi MDSCs (B), CD3‐ NKp46+ NK cells (C), NKp46+ CD107a+ NK cells (D), or CD69+ NK cells (E)
- F–H
Analysis of STAT3 phosphorylation by MSC2 cells after 18 h co‐culture with BJcl2 overexpressing or compromised for TRF2 and the target genes (F). Histograms of the pSTAT3 mean fluorescence intensity (MFI) of MSC2 cells when TRF2 was overexpressed and the target gene knocked down (G) and when both TRF2 and its target gene were knocked down (H).
- I
Histograms of tumor weights on day 19 after implantation of subcutaneous xenografts containing BJcl2 cells overexpressing or knocked down for HS3ST4 or GPC6.
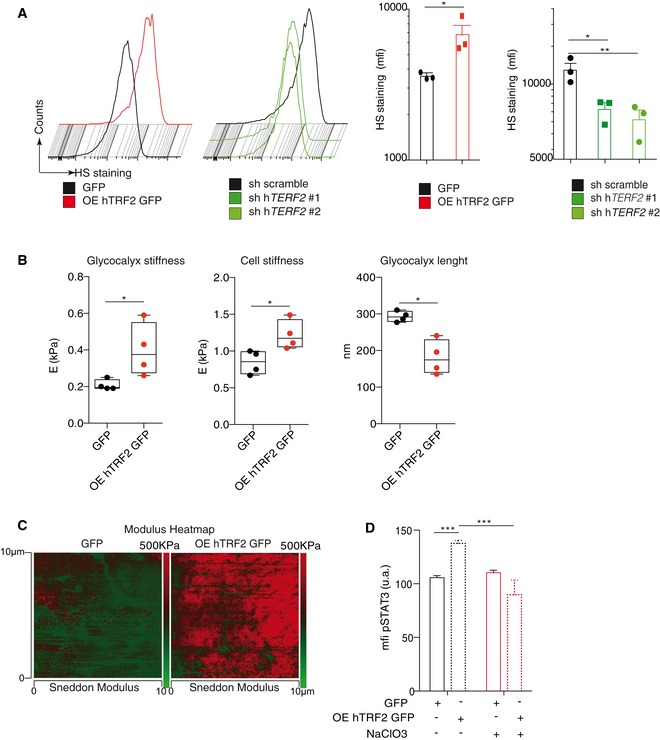
Analysis of heparan sulfate (HS) expression by FACS using the 10E4 antibody.
Atomic force microscopic (AFM) analysis of glycocalyx and cell stiffness and glycocalyx length.
AFM images showing the modulus heatmap (stiffness) in GFP‐expressing or TRF2‐overexpressing cancer cells. At each of the 128 × 128 force curve points, corresponding to an area of 10 μm2, the AFM software automatically displays the Sneddon modulus analysis while scanning the sample. The color bar on the left of the images shows a qualitative representation of the elastic map.
Analysis of pSTAT3 levels in MDSCs after co‐culture with GFP‐expressing or TRF2‐overexpressing cancer cells treated with or without sodium chlorate (NaClO3).
- A
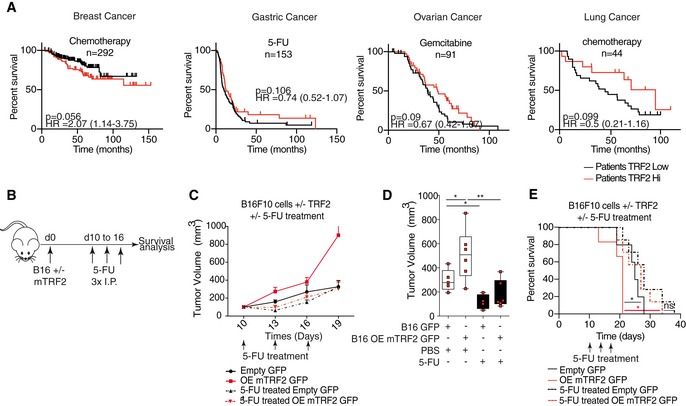
Kaplan–Meier curves for overall survival of chemotherapy‐treated patients according to the TRF2 expression level (KM‐plotter,
http://kmplot.com/analysis/index.php?p=background ). - B–E
Schematic representation of the mouse experiment. Immunocompetent mice were subcutaneously engrafted with B16F10 cells with or without TRF2 overexpression and treated with three intraperitoneal injections of 50 mg/kg 5‐FU. The tumor volume was determined every 2 days using a caliper, and growth curves over time (C) and tumor volume were determined on day 19 and represented using box plots min to max showing all points with median (D). Overall survival was also determined (E).
- A
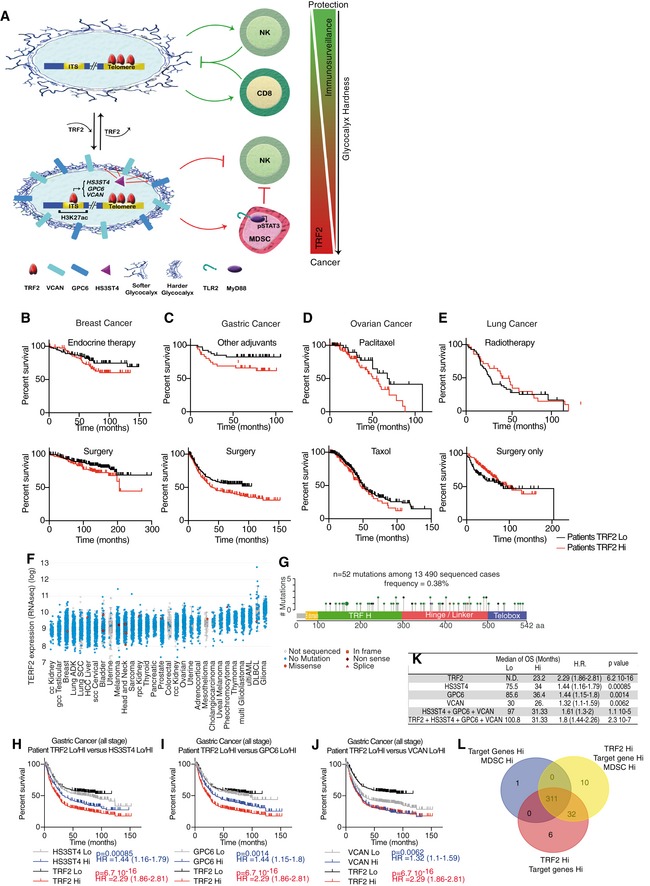
Graphical model arising from our main results.
- B–E
Kaplan–Meier curves for overall survival of chemotherapy‐ or surgery‐treated patients with breast (B), gastric (C), ovarian (D), or lung (E) cancer according to the TRF2 expression level (KM‐plotter,
http://kmplot.com/analysis/index.php?p=background ). - F
RNAseq analysis of TERF2 expression of 30 types of malignancies compared with normal tissues. Cases harboring mutations are depicted in the graph.
- G
The numbers, frequencies, and locations of mutations in the TERF2 gene among 13,490 sequenced cases.
- H–J
The overall survival of gastric cancer patients (all stages) was analyzed depending on the expression level of HS3ST4 (H) or GPC6 (I) or VCAN (J) compared to TRF2 expression using KM‐plotter.
- K
Table summarizing the median of survival (months), P‐values, and hazard ratio depending on TRF2, HS3ST4, GPC6, or VCAN expression.
- L
Venn diagram associated with Fig 7F showing the intersection between the three categories of patients.
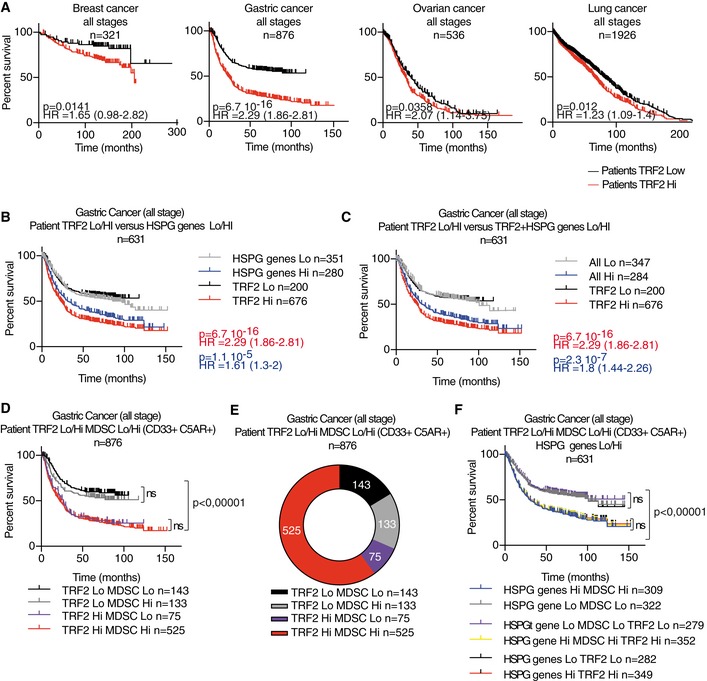
- A
Kaplan–Meier curves for overall survival of patients at all stages of cancers (breast, gastric, ovarian, and lung cancer) depending on TRF2 expression level (KMplot,
http://kmplot.com/analysis/index.php?p=background ). - B–D
The overall survival of gastric cancer patients (all stages) was analyzed depending on TRF2 and its target gene expression level (HS3ST4, GPC6, and VCAN collectively named the HSPG genes) or with MDSC level (Lo or Hi), determined as the mean expression level of CD33 and C5AR, using KMplot,
http://kmplot.com/analysis/index.php?p=background . - E
Repartition of number of gastric cancer patients depending on TRF2 and MDSC classification.
- F
Overall survival of gastric cancer patients (all stages) analyzed depending on TRF2, HSPG genes (HS3ST4, GPC6, and VCAN) and MDSC level (Lo or Hi).
References
-
- Apetoh L, Vegran F (2011) Restoration of antitumor immunity through selective inhibition of myeloid derived suppressor cells by anticancer therapies. Curr Mol Med 11: 365–372 - PubMed
-
- Artandi SE, Chang S, Lee SL, Alson S, Gottlieb GJ, Chin L, DePinho RA (2000) Telomere dysfunction promotes non‐reciprocal translocations and epithelial cancers in mice. Nature 406: 641–645 - PubMed
-
- Bejarano L, Schuhmacher AJ, Méndez M, Megías D, Blanco‐Aparicio C, Martínez S, Pastor J, Squatrito M, Blasco MA (2017) Inhibition of TRF1 telomere protein impairs tumor initiation and progression in glioblastoma mouse models and patient‐derived xenografts. Cancer Cell 32: 590–607.e4 - PubMed
-
- Biroccio A, Cherfils Vicini J, Augereau A, Pinte S, Bauwens S, Ye J, Simonet T, Horard B, Jamet K, Cervera L et al (2013) TRF2 inhibits a cell‐extrinsic pathway through which natural killer cells eliminate cancer cells. Nat Cell Biol 15: 818–828 - PubMed
Publication types
MeSH terms
Substances
LinkOut - more resources
Full Text Sources
Other Literature Sources
Research Materials
Miscellaneous
