. 2019 Jun 3;151(6):771-785.
doi: 10.1085/jgp.201812269. Epub 2019 Apr 18.

Phase 1 repolarization rate defines Ca2+ dynamics and contractility on intact mouse hearts

Affiliations

Phase 1 repolarization rate defines Ca2+ dynamics and contractility on intact mouse hearts

María Micaela López Alarcón et al. J Gen Physiol. .

Abstract

In the heart, Ca2+ influx through L-type Ca2+ channels triggers Ca2+ release from the sarcoplasmic reticulum. In most mammals, this influx occurs during the ventricular action potential (AP) plateau phase 2. However, in murine models, the influx through L-type Ca2+ channels happens in early repolarizing phase 1. The aim of this work is to assess if changes in the open probability of 4-aminopyridine (4-AP)-sensitive Kv channels defining the outward K+ current during phase 1 can modulate Ca2+ currents, Ca2+ transients, and systolic pressure during the cardiac cycle in intact perfused beating hearts. Pulsed local-field fluorescence microscopy and loose-patch photolysis were used to test the hypothesis that a decrease in a transient K+ current (Ito) will enhance Ca2+ influx and promote a larger Ca2+ transient. Simultaneous recordings of Ca2+ transients and APs by pulsed local-field fluorescence microscopy and loose-patch photolysis showed that a reduction in the phase 1 repolarization rate increases the amplitude of Ca2+ transients due to an increase in Ca2+ influx through L-type Ca2+ channels. Moreover, 4-AP induced an increase in the time required for AP to reach 30% repolarization, and the amplitude of Ca2+ transients was larger in epicardium than endocardium. On the other hand, the activation of Ito with NS5806 resulted in a reduction of Ca2+ current amplitude that led to a reduction of the amplitude of Ca2+ transients. Finally, the 4-AP effect on AP phase 1 was significantly smaller when the L-type Ca2+ current was partially blocked with nifedipine, indicating that the phase 1 rate of repolarization is defined by the competition between an outward K+ current and an inward Ca2+ current.


Figures

Figure 1.
Figure 1.
Methodology for intraventricular pressure measurements. (A) Positioning of the trocar in the apex of the left ventricle before the connection to the valve cannula. (B) Instrumentation arrangement to measure the ventricular pressure at different end-diastolic pressures. (C) A typical representative trace of the left ventricular pressure at different preloads. (D) A typical relationship between the diastolic (green circles) and systolic (orange circles) pressures for different preloads.
Figure 2.
Figure 2.
4-AP increases the developed ventricular systolic pressure in intact mouse hearts. (A) Time course of the developed pressure during the cardiac cycle in the absence (control) and presence of 10 µM 4-AP. Inset illustrates the increase in the developed pressure induced by 300 nM of the positive ionotropic agent isoproterenol (ISO). (B) Plot of the evolution of the developed systolic pressure peak value upon perfusion with different concentrations of 4-AP. The 4-AP–containing solutions were retro-perfused through the coronary circulation. A 12-s application of 4-AP significantly increased the systolic pressure. This pressure response recovered to the initial systolic pressure when 4-AP was washed out. (C) Dose–response curve for different concentrations of 4-AP. All the tested 4-AP concentrations induced a significant increase in the systolic pressures (peak of the developed pressure, 1,099 total measurements) with respect to the control condition. n = 5 hearts.
Figure 3.
Figure 3.
4-AP application induces a larger increase on APD30 than on APD90. (A–C) Consecutive recordings of epicardial ventricular AP upon perfusion with different concentrations of 4-AP. The black arrows indicate the beginning and end of 4-AP perfusion. The blue arrows indicate the direction of the [4-AP] increase. Note that [4-AP] does not increase instantaneously due to the rate limited coronary and capillary perfusion. (D and E) The effect of different 4-AP concentrations on AP repolarization evaluated by assessing the APD30 and APD90 of consecutive epicardial APs. It is possible to observe that the effect on APD30 is significantly larger than on APD90.
Figure 4.
Figure 4.
Effect of 4-AP on the left ventricle transmural ECG signal. (A) Superimposed epicardial AP (red trace) and transmural ECG (black trace) recorded from the left ventricle. It is possible to appreciate that the J wave reflects the fast repolarization during phase 1 and the T wave coincides with phase 3. The black arrows indicate the position where APD30 and APD90 were evaluated. (B and C) The effect of two different concentrations (10 and 100 µM) of 4-AP on transmural ECG recordings. Inset of C: 4-AP reduces the amplitude and increases the duration of the J wave (dark cyan trace) relative to control (black trace). Thus, the perfusion with 100 µM 4-AP reduces the left ventricle transmural repolarization gradient. (D) Measurements of the J wave half duration in the presence of 100 µM 4-AP. The drug significantly spread out the J wave (1.0 ± 0.04, 1,065 measurements for the control condition, black circles; vs. 2.03 ± 0.11, 870 measurements for 4-AP, dark cyan circles). (E) Measurements of the J wave amplitude of four different ECG experiments. Although there is scattering in the data, it is possible to observe that 4-AP has a large effect on J wave amplitude (1.0 ± 0.09, 675 measurements for the control condition, black circles; vs. 0.57 ± 0.32, 891 measurements for 4-AP, dark cyan circles). For all the experiments, the population means between control and the perfused hearts with 100 µM 4-AP were significantly different (*, P < 0.001). n = 4 hearts.
Figure 5.
Figure 5.
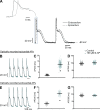
Differential effect of 4-AP on simultaneous epicardial and endocardial optically recorded APs. (A) The kinetic differences between epicardial and endocardial APs recoded simultaneously on an intact perfused heart. It is possible to observe the differences in the kinetics of these transmurally recorded APs. In the inset, we can see that there is not only a delay between the endocardial and the epicardial APs, but also that the rate of repolarization during phase 1 is slower in the endocardium. (B and E) The effect of 100 µM 4-AP (dark cyan traces) on the kinetics of epicardial and endocardial AP, respectively. (C and F) The distribution of the APD30 measurements of epicardial and endocardial APs before and after the application of 100 µM 4-AP. 4-AP induces a significant decrease in the rate of repolarization. Interestingly, there are statistically significant differences (*) in the APD30 (P < 0.001) between endocardium (4.65 ± 0.76 ms, 377 measurements, black circles; F) and epicardium (2.34 ± 0.37 ms, 376 measurements, black circles; C) before the application of the drug. However, this statistically significant difference between endocardium and epicardium disappears when the hearts are perfused with 100 µM 4-AP (14.21 ± 1.36 ms, 499 measurements, dark cyan circles, F vs. 12.17 ± 1.88 ms, 499 measurements, dark cyan circles; C). (D and G) The perfusion with 100 µM 4-AP does not induce statistically significant changes at the APD90 level (P < 0.001) for epicardium (95.62 ± 4.95 ms, 494 measurements, black circles; vs. 101.75 ± 5.53 ms, 497 measurements, dark cyan circles; D) and endocardium (90.34 ± 4.21 ms, 374 measurements, black circles vs. 90.93 ± 3.33 ms, 499 measurements, dark cyan circles; G). n = 10 hearts.
Figure 6.
Figure 6.
4-AP has a larger effect on epicardial than on endocardial Ca2+ transients. (A and E) The effect of 100 µM 4-AP on the amplitude and the kinetics of Ca2+ transients recorded simultaneously in epicardium and endocardium when the heart was externally paced at 7 Hz. (B–D) The effect of 100 µM 4-AP on different parameters of epicardial Ca2+ transients. (E and F) 100 µM 4-AP has a significant effect (*) on the amplitude of endocardial Ca2+ transients. However, if we compare the magnitude of the effect of 100 µM 4-AP on endocardium (F; dark cyan circles) versus epicardium (B; dark cyan circles), the effect in endocardium is significantly smaller (1.13 ± 0.07 times, 588 measurements, dark cyan circles; E vs. 1.33 ± 0.04 times, 557 measurements, dark cyan circles; B). (C and G) 100 µM 4-AP has a significant effect (*, P < 0.001) on the rise time of the Ca2+ transients in the epicardium (8.42 ± 0.58 ms, 662 measurements, black circles vs. 8.78 ± 0.72 ms, 623 measurements, dark cyan circles; C) and the endocardium (8.79 ± 0.89 ms, 474 measurements, black circles vs. 9.24 ± 1.34 ms, 400 measurements, dark cyan circles; G). n = 4 hearts. (D and H) 100 µM 4-AP has a significant effect (*, P < 0.001) on the half relaxation time of the Ca2+ transients in the epicardium (46.5 ± 3.9 ms, 662 measurements, black circles vs. 52.9 ± 4.3 ms, 663 measurements, dark cyan circles; D) and the endocardium (41.11 ± 3.6 ms, 451 measurements, black circles vs. 46.92 ± 3.24 ms, 623 measurements, dark cyan circles; D). n = 4 hearts.
Figure 7.
Figure 7.
The increase in contractility promoted by 4-AP is driven by an increase in the L-type Ca2+ current during phase 1. (A and B) Time course of Ca2+-dependent ionic currents recorded with LPP before (black trace) and after (dark cyan trace) the hearts were perfused with 100 µM 4-AP. (C) 4-AP increases the amplitude of the early Ca2+ current (6.16 ± 0.66 nA/nF, eight measurements, black circles vs. 8.67 ± 0.44 nA/nF, seven measurements, dark cyan circles). (D and E) 4-AP not only increases the amplitude of the early component but also increases its duration and time integral (1.13 ± 0.99 times, 21 measurements, black circles vs. 1.57 ± 0.25 times, 17 measurements, dark cyan circles). Results from five different hearts illustrate that the amount of Ca2+ that gets into the cell during 4-AP perfusion is significantly larger (*) respect to their controls at P > 0.001. n = 5 hearts.
Figure 8.
Figure 8.
L-type Ca2+ currents can define the rate of repolarization during phase 1. (A) Effect of nifedipine (Nife; red trace) and 4-AP (cyan trace) on the time course of an epicardial AP. While 10 µM Nife alone induced a notorious effect on phase 2, Nife + 4-AP modified phase 1 and phase 2. (B and C) Summarized results from five different hearts. B shows that 100 µM 4-AP has a significant effect (*, P < 0.001) on APD30 (2.50 ± 0.32 ms, 1,654 measurements, light green squares vs. 7.89 ± 0.94 ms, 1,115 measurements, orange circles; B) that can be washed out (P < 0.001; 7.89 ± 0.94 ms, 1,115 measurements, orange circles vs. 2.92 ± 0.61 ms, 1,311 measurements, wine triangles; B). C shows that 100 µM 4-AP, in the presence of Nife, significantly increases (*, P < 0.001) APD30 (1.62 ± 0.14 ms, 398 measurements, red squares vs. 2.85 ± 0.92 ms, 368 measurements, cyan circles; C) and that this effect can be also washed out (P < 0.001; 2.85 ± 0.92 ms, 368 measurements, cyan circles vs. 1.95 ± 0.43 ms, 389 measurements, blue triangles; C). Nife not only significantly reduces (P < 0.001) the APD30 under control conditions (2.50 ± 0.32 ms, 1,654 measurements, light green squares; B vs. 1.62 ± 0.14 ms, 398 measurements, red squares; C) but also shows a significant effect (P < 0.001) in the presence of 100 µM 4-AP (7.89 ± 0.94 ms, 1,115 measurements, orange circles; B vs. 2.85 ± 0.92 ms, 368 measurements, cyan circles; C). n = 5 hearts.
Figure 9.
Figure 9.
NS5806 accelerates phase 1 repolarization. (A) Effect of NS5806 on the time course of epicardial AP, where the black traces are the controls and the violet traces are in the presence of 10 µM NS5805. NS5806 shortened both APD30 (see inset) and APD90. (B) The significant effect (*, P < 0.001) of 10 µM NS5805 on APD30 (3.53 ± 0.34 ms, 1,059 measurements, black circles vs. 2.21 ± 0.37 ms, 808 measurements, violet circles). (C) The significant effect (*, P < 0.001) of 10 µM NS5805 on APD90 (87.06 ± 5.52 ms, 1,057 measurements, black circles vs. 63.73 ± 5.23 ms, 808 measurements, violet circles). n = 5 hearts.
Figure 10.
Figure 10.
NS5806 decreases the left ventricle developed pressure. (A) Time course of the left ventricle developed pressure during an isotonic contraction at a constant afterload before (black trace) and after (violet trace) perfusion with 30 µM NS5806. (B) The significant effect (*, P < 0.001) of NS5806 on the normalized developed pressure (103.3 ± 6.7%, 85 measurements for the control, black circles vs. 38.03 ± 5.48%, 125 measurements for NS5806, violet circles). n = 3 hearts.
Figure 11.
Figure 11.
NS5806 decreases the left ventricle developed pressure by decreasing the amplitude and the duration of Ca2+ transients. (A) Effect of 10 µM NS5806 on the time course of epicardial Ca2+ transients. (B) The significant effect (*, P < 0.001) on the amplitude (100.1 ± 3.2%, 179 measurements for the control, black circles vs. 85.9 ± 2.1%, 180 measurements for NS5806, violet circles). (C) 10 µM NS5806 has a significant effect (*, P < 0.01) on the rise time of epicardial Ca2+ transients (7.42 ± 1.06 ms, 604 measurements for the control, black circles vs. 6.8 ± 0.8 ms, 480 measurements for NS5806, violet circles). (D) 10 µM NS5806 has a significant effect (*, P < 0.01) on the half relaxation time of epicardial Ca2+ transients (47.5 ± 4.4 ms, 594 measurements for the control, black circles vs. 45.1 ± 3.8 ms, 480 measurements for NS5806, violet circles). n = 4 hearts.
Figure 12.
Figure 12.
NS5806 decreases the amplitude of Ca2+ transients by reducing Ca2+ influx through L-type Ca2+ channels. (A and B) Effect of 10 µM NS5806 on the amplitude and kinetics of Ca2+-mediated currents. (C) Comparison of the kinetics of the L-type Ca2+ current in the absence (black trace) and the presence (violet trace) of 10 µM NS5806. (D) Summarized significant effect (*, P < 0.001) of 10 µM NS5806. NS5806 reduces the amount of Ca2+ permeating (fractional integral of the Ca2+ current) into the myocytes (1.02 ± 0.11, 10 measurements the control, black circles vs. 0.47 ± 0.18, 17 measurements for NS5806, violet circles). n = 5 hearts.

Similar articles

Cited by

References

    1. Aguilar-Sanchez Y., Fainstein D., Mejia-Alvarez R., and Escobar A.L.. 2017. Local Field Fluorescence Microscopy: Imaging Cellular Signals in Intact Hearts. J. Vis. Exp. (121). 10.3791/55202 - DOI - PMC - PubMed
    1. Almers W., Roberts W.M., and Ruff R.L.. 1984. Voltage clamp of rat and human skeletal muscle: measurements with an improved loose-patch technique. J. Physiol. 347:751–768. 10.1113/jphysiol.1984.sp015094 - DOI - PMC - PubMed
    1. Bányász T., Fülöp L., Magyar J., Szentandrássy N., Varró A., and Nánási P.P.. 2003. Endocardial versus epicardial differences in L-type calcium current in canine ventricular myocytes studied by action potential voltage clamp. Cardiovasc. Res. 58:66–75. 10.1016/S0008-6363(02)00853-2 - DOI - PubMed
    1. Bouchard R.A., Clark R.B., and Giles W.R.. 1995. Effects of action potential duration on excitation-contraction coupling in rat ventricular myocytes. Action potential voltage-clamp measurements. Circ. Res. 76:790–801. 10.1161/01.RES.76.5.790 - DOI - PubMed
    1. Brunet S., Aimond F., Li H., Guo W., Eldstrom J., Fedida D., Yamada K.A., and Nerbonne J.M.. 2004. Heterogeneous expression of repolarizing, voltage-gated K+ currents in adult mouse ventricles. J. Physiol. 559:103–120. 10.1113/jphysiol.2004.063347 - DOI - PMC - PubMed

Publication types

MeSH terms