. 2019 Jul;17(7):1503-1518.
doi: 10.1158/1541-7786.MCR-18-1121. Epub 2019 Apr 18.

GSK2801, a BAZ2/BRD9 Bromodomain Inhibitor, Synergizes with BET Inhibitors to Induce Apoptosis in Triple-Negative Breast Cancer

Affiliations

GSK2801, a BAZ2/BRD9 Bromodomain Inhibitor, Synergizes with BET Inhibitors to Induce Apoptosis in Triple-Negative Breast Cancer

Samantha M Bevill et al. Mol Cancer Res. 2019 Jul.

Abstract

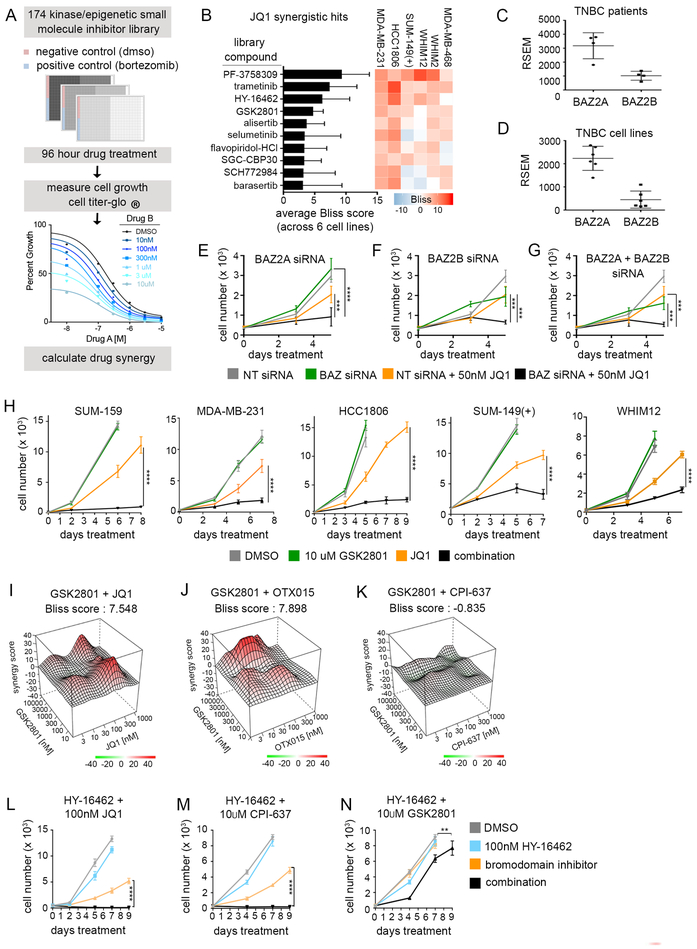
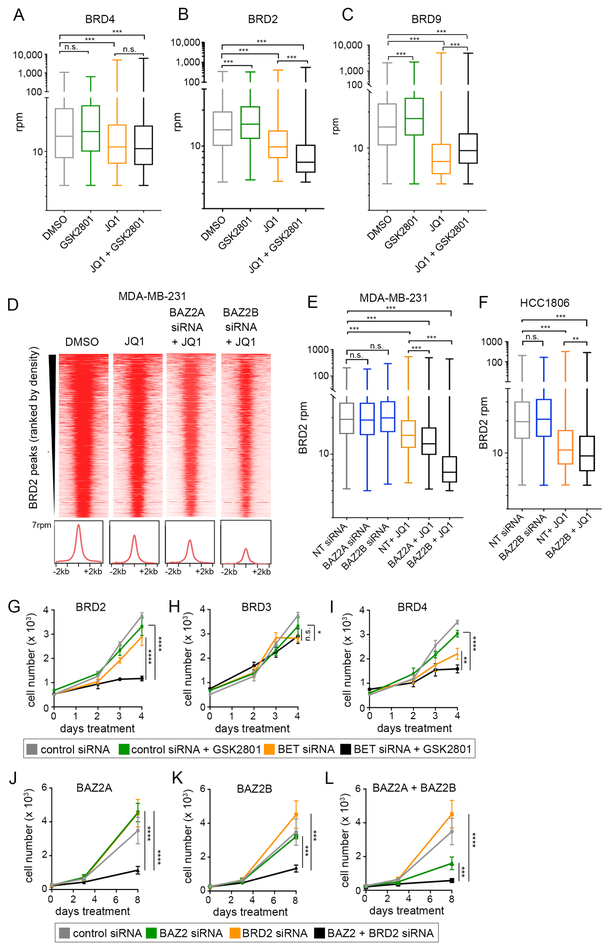
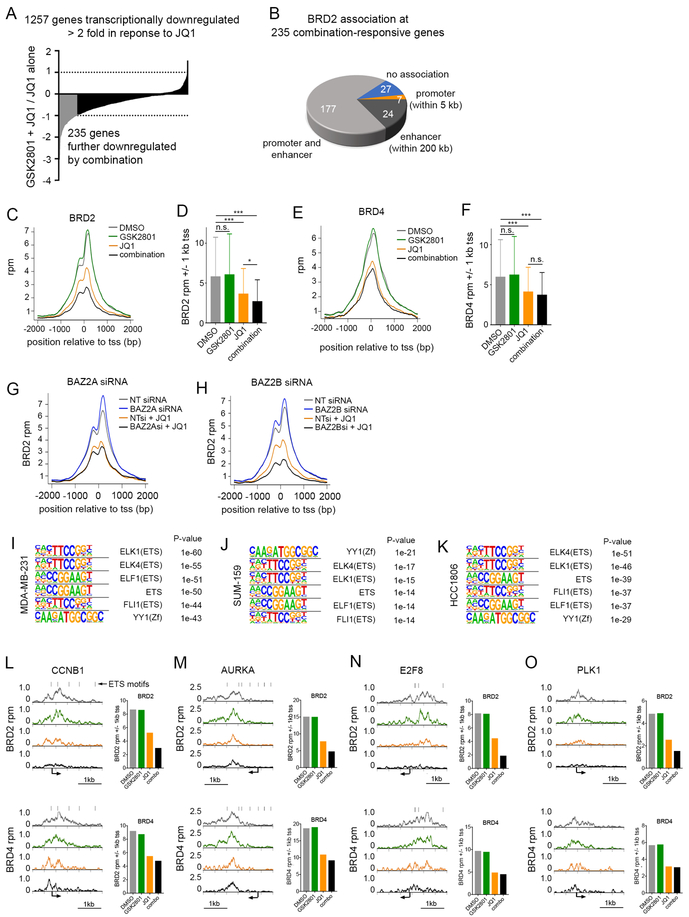
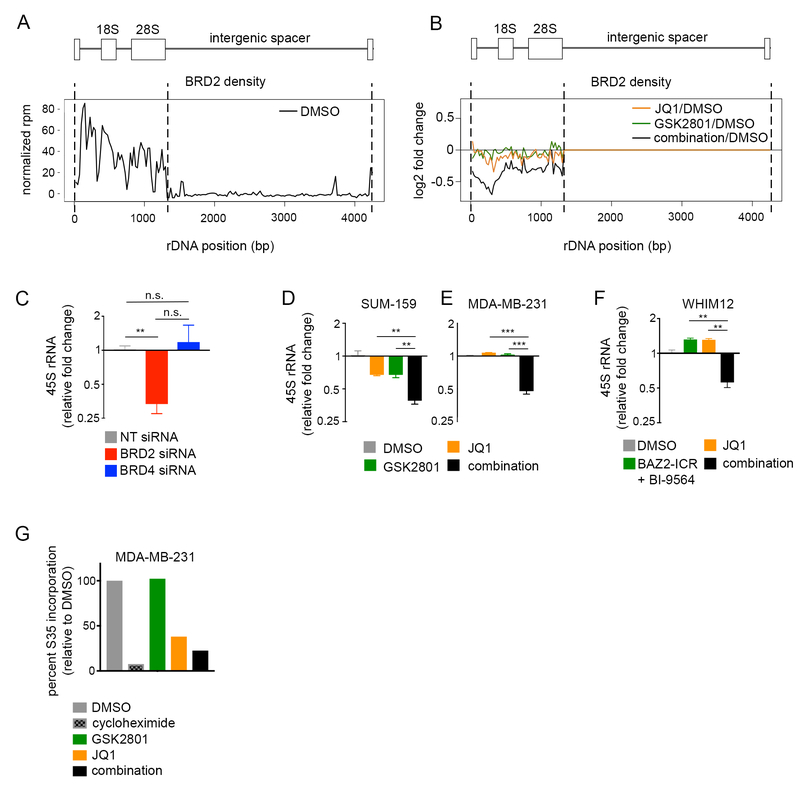
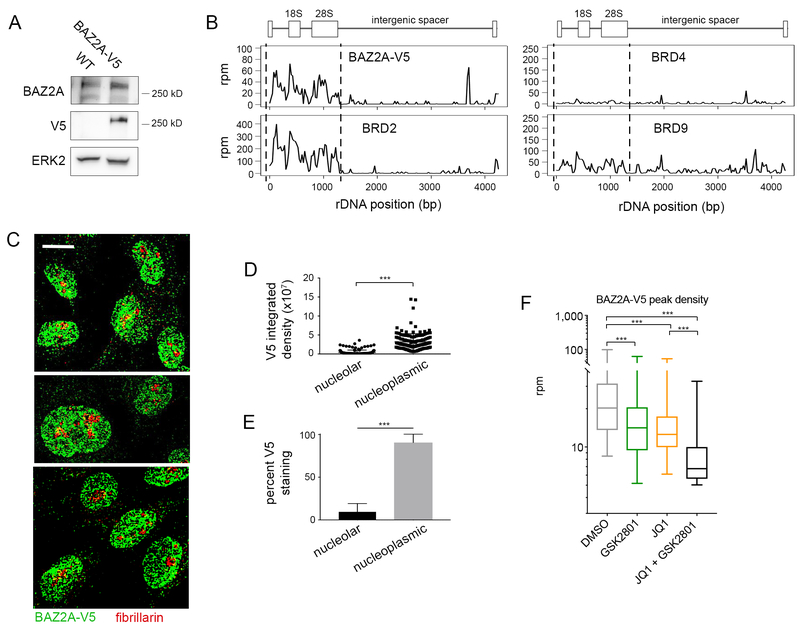
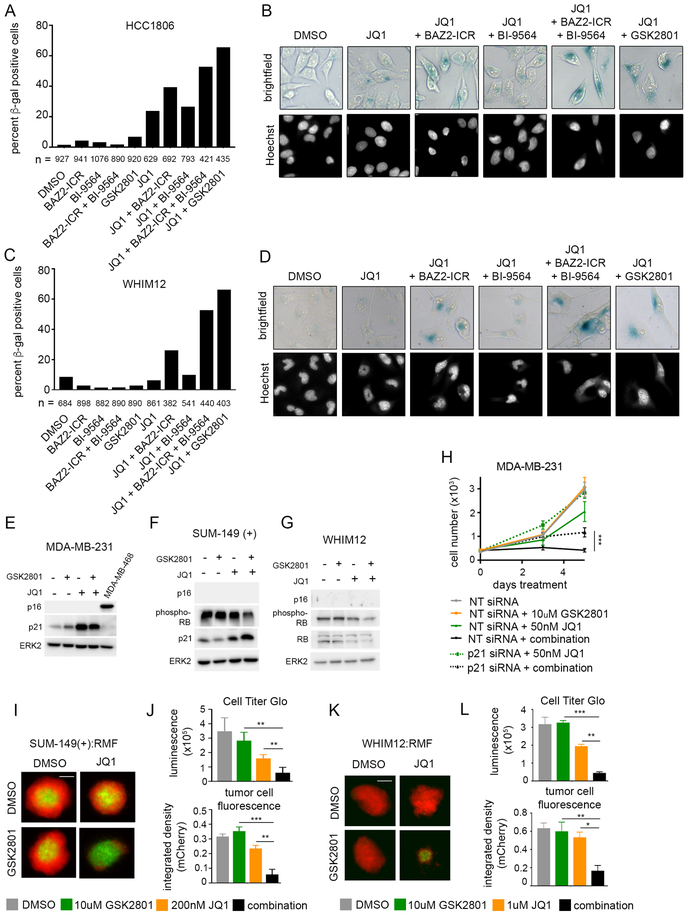
Screening of an inhibitor library targeting kinases and epigenetic regulators identified several molecules having antiproliferative synergy with extraterminal domain (BET) bromodomain (BD) inhibitors (JQ1, OTX015) in triple-negative breast cancer (TNBC). GSK2801, an inhibitor of BAZ2A/B BDs, of the imitation switch chromatin remodeling complexes, and BRD9, of the SWI/SNF complex, demonstrated synergy independent of BRD4 control of P-TEFb-mediated pause-release of RNA polymerase II. GSK2801 or RNAi knockdown of BAZ2A/B with JQ1 selectively displaced BRD2 at promoters/enhancers of ETS-regulated genes. Additional displacement of BRD2 from rDNA in the nucleolus coincided with decreased 45S rRNA, revealing a function of BRD2 in regulating RNA polymerase I transcription. In 2D cultures, enhanced displacement of BRD2 from chromatin by combination drug treatment induced senescence. In spheroid cultures, combination treatment induced cleaved caspase-3 and cleaved PARP characteristic of apoptosis in tumor cells. Thus, GSK2801 blocks BRD2-driven transcription in combination with BET inhibitor and induces apoptosis of TNBC. IMPLICATIONS: Synergistic inhibition of BDs encoded in BAZ2A/B, BRD9, and BET proteins induces apoptosis of TNBC by a combinatorial suppression of ribosomal DNA transcription and ETS-regulated genes.


Conflict of interest statement

Declaration of interests: The authors declare no competing interests.

Figures

Figure 1:
Figure 1:. Drug synergy screens against BET and p300 BD inhibitors in TNBC cell lines.
(A) Schematic for screening approach. Cells were plated in 384 well plates and treated 96 hours with 6 × 6 dose concentrations of library compound in combination with either JQ1 (BETi) or CPI-637 (p300i). Cell viability was measured with Cell Titer-Glo and drug synergy was quantified using Synergy Finder. (B) Drug synergy rankings using Bliss scoring for JQ1 screens (performed in MDA-MB-231, HCC1806, SUM-149(+), MDA-MB-468, WHIM2, and WHIM12). Synergy scores represent the percent inhibition observed following combination treatment which exceeded the expected growth inhibition as calculated by the bliss independence model. Values were generated by first calculating the mean Bliss score across the full drug synergy matrix for each cell line (36 possible dose combinations). (C-D) RNA-seq reads of BAZ2A and BAZ2B expression in primary TNBC patient samples (C) vs. 6 TNBC cell lines (D) used for screening. (E-G) MDA-MB-231 growth curves transfected with non-targeting (NT) or BAZ2 siRNAs in combination with 50 nM JQ1. Error bars represent +/− SD, n = 6. P-values were calculated using two-tailed t-tests. (H) Growth curves across multiple TNBC cell lines with 10μM GSK2801. JQ1 doses were determined based on the relative sensitivity of each cell line. MDA-MB-231: 30nM JQ1, SUM159: 100nM JQ1, SUM-149(+) and WHIM12: 300nM JQ1, HCC1806: 500nM JQ1. Error bars represent +/− standard deviation, n = 6. P-values comparing JQ1 vs. combination drug treatment were calculated using two-tailed t-tests. (I-K) 3D drug interaction landscapes produced using SynergyFinder between GSK2801 and JQ1/OTX015 or CPI-637 in the MDA-MB-231 cell line following 96-hour drug treatment. (L-N) MDA-MB-231 growth curves with 100 nM HY-16462 in combination with 100 nM JQ1, 10 μM CPI-637, or 10 μM GSK2801. Error bars represent +/− SD, n = 6. P-values comparing BDi vs. combination drug treatment were calculated using two-tailed t-tests.
Figure 2:
Figure 2:. BRD2 is displace from chromatin following combination drug treatment.
(A-C) Levels of mapped BRD4 (A) BRD2 (B) and BRD9 (C) union peak density following 48 hours treatment with 100 nM JQ1, 10 μM GSK2801, or the combination in MDA-MB-231 cells. Statistical significance was measured via two tailed, paired t-tests. (D-E) BRD2 peak density following transfection with 25 nM non-targeting (NT), BAZ2A or BAZ2B siRNA. MDA-MB-231 cells were treated 48 hours following transfection +/− 100 nM JQ1. Statistical significance was measured via two-tailed, paired t-tests. (F) BRD2 density following transfection with 25 nM non-targeting (NT) or BAZ2B siRNA alone and in combination with 500 nM JQ1 treatment in the HCC1806 cell line. Statistical significance was measured via two-tailed, paired t-tests. (G-I) MDA-MB-231 growth curves transfected with GAPDH siRNA as a control or 25 nM BRD2 siRNA (G), 25 nM BRD3 siRNA (H), and 1nM BRD4 siRNA (I) alone and in combination with 10 μM GSK2801. Error bars represent +/− SD, n = 6. P-values were calculated using two-tailed t-tests. (J-L) MDA-MB-231 cells transfected with 25 nM non-targeting (NT) or BRD2 siRNA alone and in combination with 25 nM BAZ2A siRNA (J), BAZ2B siRNA (K) or BAZ2A + BAZ2B siRNAs (L). Error bars represent +/− SD, n = 6. P-values were calculated using two-tailed t-tests.
Figure 3:
Figure 3:. BRD2 is displaced from ETS-regulated gene promoters and enhancers following combination treatment with GSK2801 and JQ1.
(A) Long tail plot of MDA-MB-231 genes downregulated ≥ 2-fold following 72-hour treatment with 100 nM JQ1. Values represent mRNA fold-change between treatment with 10 μM GSK2801 + JQ1 vs JQ1 alone. Genes highlighted in grey were downregulated ≥ 2-fold in combination treated cells relative to JQ1 alone. (B) Association of BRD2 peaks with “combination-responsive” genes in DMSO treated MDA-MB-231 cells. (C-F) Metagene plots of BRD2 (C) and BRD4 (E) density at transcription start sites (tss) of “combination-responsive” genes. MDA-MB-231 cells were treated 48 hours with DMSO, 10 μM GSK2801, 100 nM JQ1 or the combination. Bar plots represent total read counts of BRD2 (D) or BRD4 (F) +/− 1 kb of the tss. P-values were calculated via two-tailed, paired t-tests (G-H) Metagene plots of BRD2 density at tss of “combination-responsive” genes following transfection with BAZ2A (G) or BAZ2B (H) siRNA. MDA-MB-231 cells were treated 48 hours with and without 100 nM JQ1 following transfection. (I-K) Motif analysis of BRD2 binding in DMSO treated samples of MDA-MB-231 (I), SUM-159 (J), and HCC1806 (K) cell lines. (L-O) BRD2 and BRD4 ChIP-seq density tracks following 48 hours treatment with DMSO, 10 μM GSK2801, 100 nM JQ1 or the combination in MDA-MB-231 cells. Black bars denote ETS binding motifs. Bar plots represent total read counts of BRD2 or BRD4 +/− 1 kb of the tss
Figure 4:
Figure 4:. BRD2 is the only BET protein localized to the nucleolus.
(A) GSEA of MDA-MB-231, HCC1806, and SUM-159 RNA-seq datasets treated 72 hours with 10 μM GSK2801 and 100 nM JQ1 (MDA-MB-231 and SUM-159) or 500 nM JQ1 (HCC1806). Orange values represent ribosome biogenesis or rRNA processing gene signatures. Positive enrichment scores represent gene sets enriched in DMSO and negative enrichment scores represent gene sets enriched in GSK2801 + JQ1 treated samples. (B) Immunofluorescent staining of BET proteins with fibrillarin (nucleolar marker) and Hoechst (nuclear marker) (C-D) Quantification of nucleolar vs nucleoplasmic staining intensity of BET proteins. A one-way analysis of variance (ANOVA) was conducted to compare intensity of BET protein staining, p-value < 2e-16 for (C) and (D). Post hoc comparisons were made using the Tukey HSD test.
Figure 5:
Figure 5:. Displacement of BRD2 from the rDNA repeat coincides with transcriptional repression of rRNA.
(A) Alignment of BRD2 ChIP-seq reads to the rDNA repeat in MDA-MB-231 cells. (B) Response of BRD2 density on rDNA in response to 48-hour treatment with DMSO, 10 μM GSK2801, 100 nM JQ1 or the combination in MDA-MB-231 cells. (C) qPCR measuring 45S rRNA following 96-hour transfection with non-targeting (NT), BRD2, or BRD4 siRNA in MDA-MB-231 cells. Error bars represent SD, n = 3. P-values were calculated using two-tailed t-tests. (D-E) qPCR measuring 45S rRNA in SUM-159 (D) and MDA-MB-231 (E) cells following 96-hour treatment with DMSO, 10 μM GSK2801, 100 nM JQ1 or the combination. Error bars represent SD, n = 3. P-values were calculated using two-tailed t-tests. (F) qPCR measuring 45S rRNA in the WHIM12 cell line following 96-hour treatment with 500nM JQ1 +/− 10 μM BAZ2-ICR and 300 nM BI-9564. Error bars represent SD, n = 3. P-values were calculated using two-tailed t-tests. (G) S35 labeling of protein production in MDA-MB-231 cells following 72-hour treatment with 10 μM GSK2801, 100 nM JQ1, or the combination. 100 μg/ml cycloheximide treatment was included as a positive control.
Figure 6:
Figure 6:. BAZ2A is co-regulated with BRD2 in the nucleolus and nucleoplasm.
(A) Western blot of MDA-MB-231 cell lysate expressing wildtype BAZ2A vs. BAZ2A-V5. (B) Alignment of BAZ2A-V5, BRD2, BRD4, and BRD9 ChIP-seq reads to the rDNA repeat in MDA-MB-231 cells. (C) Representative images of immunofluorescent staining of BAZ2A-V5 with fibrillarin (nucleolar marker) (D-E) Quantification of nucleolar vs nucleoplasmic staining intensity of V5 in approx. 200 individual cells. (F) Levels of BAZ2A-V5 union peak density following 48 hours treatment with 100 nM JQ1, 10 μM GSK2801, or the combination in MDA-MB-231 cells.
Figure 7:
Figure 7:. Combined GSK2801 and JQ1 treatment induces senescence and apoptosis in TNBC cell lines.
(A-D) Senescence-associated beta-galactosidase staining in HCC1806 (A-B) and WHIM12 (C-D) cell lines following 96-hour drug treatment. Cells were dosed with 10 μM GSK2801, 10 μM BAZ2-ICR, 1 μM BI-9564, and either 300 nM JQ1 (HCC1806) or 500 nM JQ1 (WHIM12). (E-G) Western blots of MDA-MB-231 (E), SUM-149(+) (F), and WHIM12 (G) cell lysates following 72-hour treatment with 10 μM GSK2801 and either 100 nM JQ1 (MDA-MB-231), 300 nM JQ1 (SUM-149(+)), or 500 nM JQ1 (WHIM12). (H) MDA-MB-231 cells transfected with 25 nM non-targeting (NT) or p21 siRNA alone and in combination with 10 μM GSK2801 and 50 nM JQ1. Error bars represent +/− SD, n = 6. (I-L) 3D spheroids with SUM-149(+) and WHIM12 cell lines co-cultured with reduction mammoplasty fibroblasts (RMF) treated ten days with GSK2801 and JQ1. Tumor cell fluorescence was measured at endpoint and cell viability was measured with Cell Titer-Glo 3D reagent, Error bars represent +/− SD, n = 3. P-values were calculated using two-tailed t-tests.

References

    1. Delmore JE, Issa GC, Lemieux ME, Rahl PB, Shi J, Jacobs HM, et al. BET Bromodomain Inhibition as a Therapeutic Strategy to Target c-Myc. Cell. 2011. September;146(6):904–17. - PMC - PubMed
    1. Ott CJ, Kopp N, Bird L, Paranal RM, Qi J, Bowman T, et al. BET bromodomain inhibition targets both c-Myc and IL7R in high-risk acute lymphoblastic leukemia. Blood. 2012. October 4;120(14):2843–52. - PMC - PubMed
    1. Zuber J, Shi J, Wang E, Rappaport AR, Herrmann H, Sison EA, et al. RNAi screen identifies Brd4 as a therapeutic target in acute myeloid leukaemia. Nature. 2011. October;478(7370):524–8. - PMC - PubMed
    1. Hargreaves DC, Horng T, Medzhitov R. Control of Inducible Gene Expression by Signal-Dependent Transcriptional Elongation. Cell. 2009. July;138(1):129–45. - PMC - PubMed
    1. Itzen F, Greifenberg AK, Bösken CA, Geyer M. Brd4 activates P-TEFb for RNA polymerase II CTD phosphorylation. Nucleic Acids Res. 2014. July 8;42(12):7577–90. - PMC - PubMed

Publication types

MeSH terms