. 2019 Jun 26;39(26):5153-5172.
doi: 10.1523/JNEUROSCI.3117-18.2019. Epub 2019 Apr 18.

Computing Social Value Conversion in the Human Brain

Affiliations

Computing Social Value Conversion in the Human Brain

Haruaki Fukuda et al. J Neurosci. .

Abstract

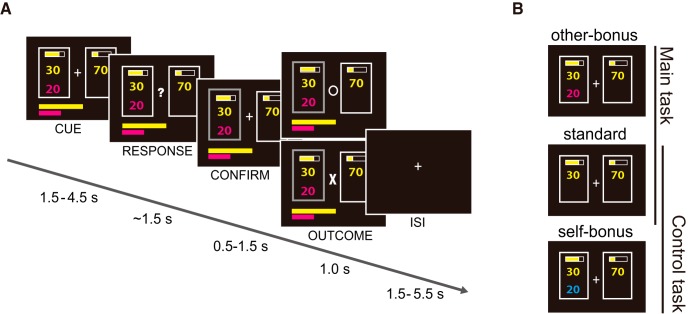
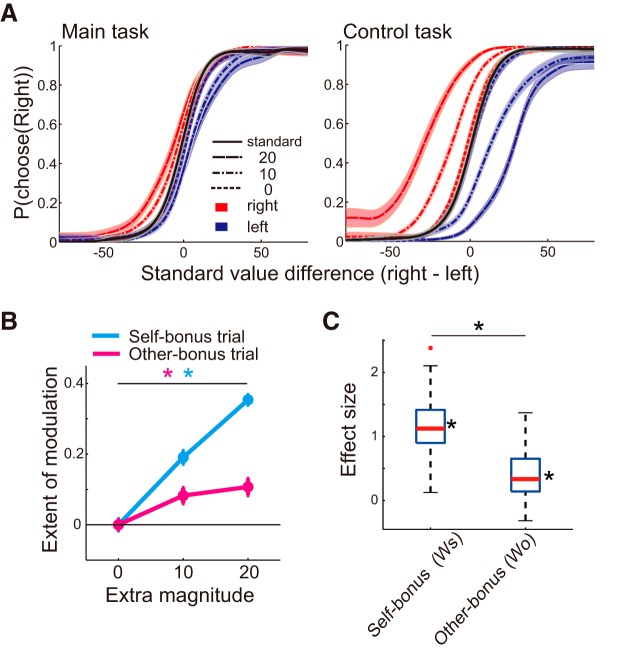
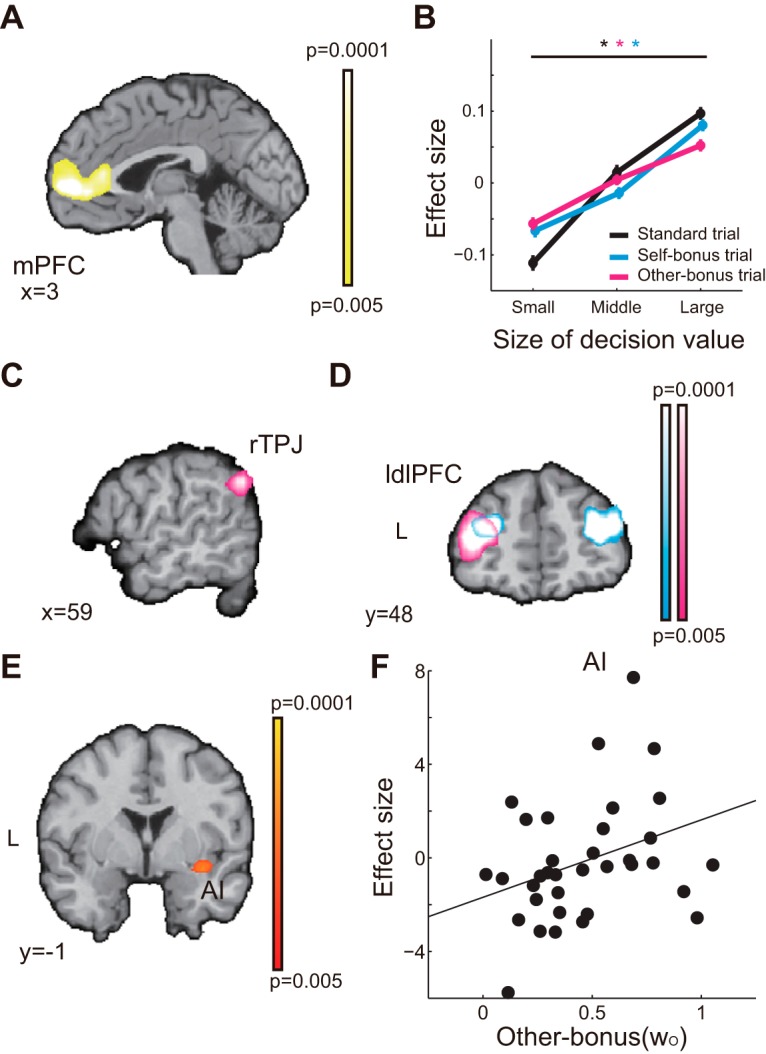
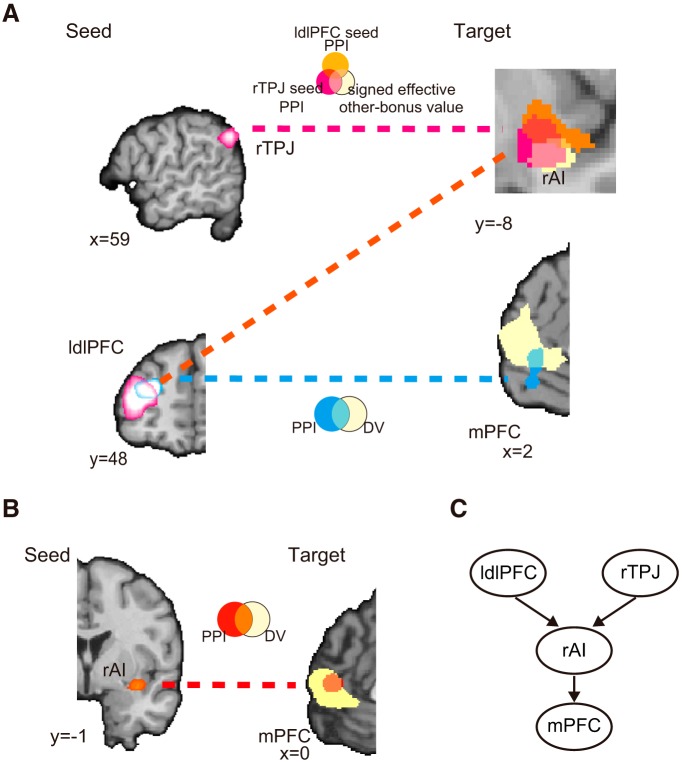
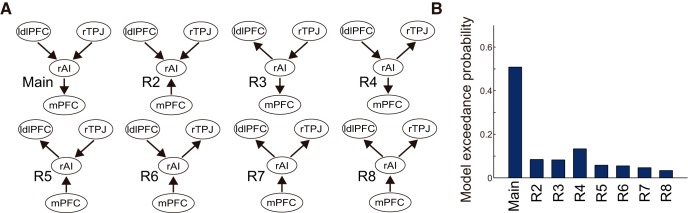
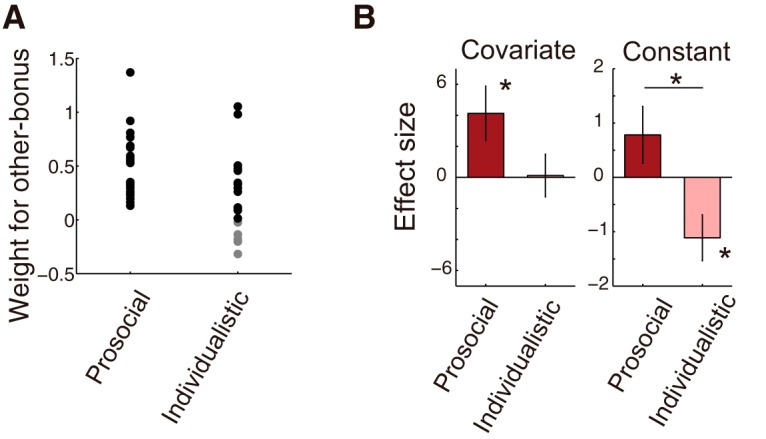
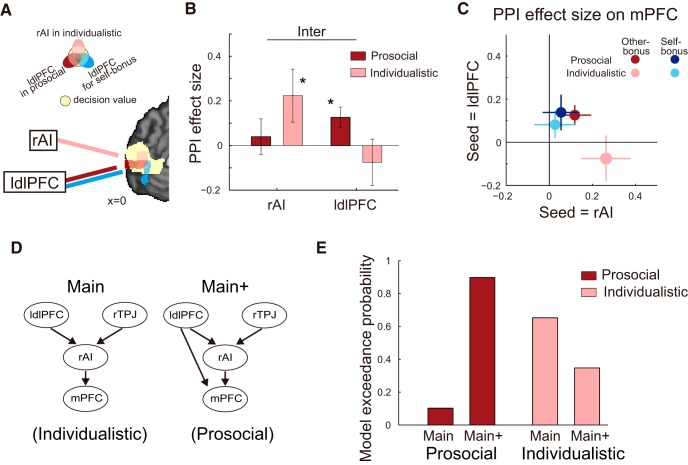
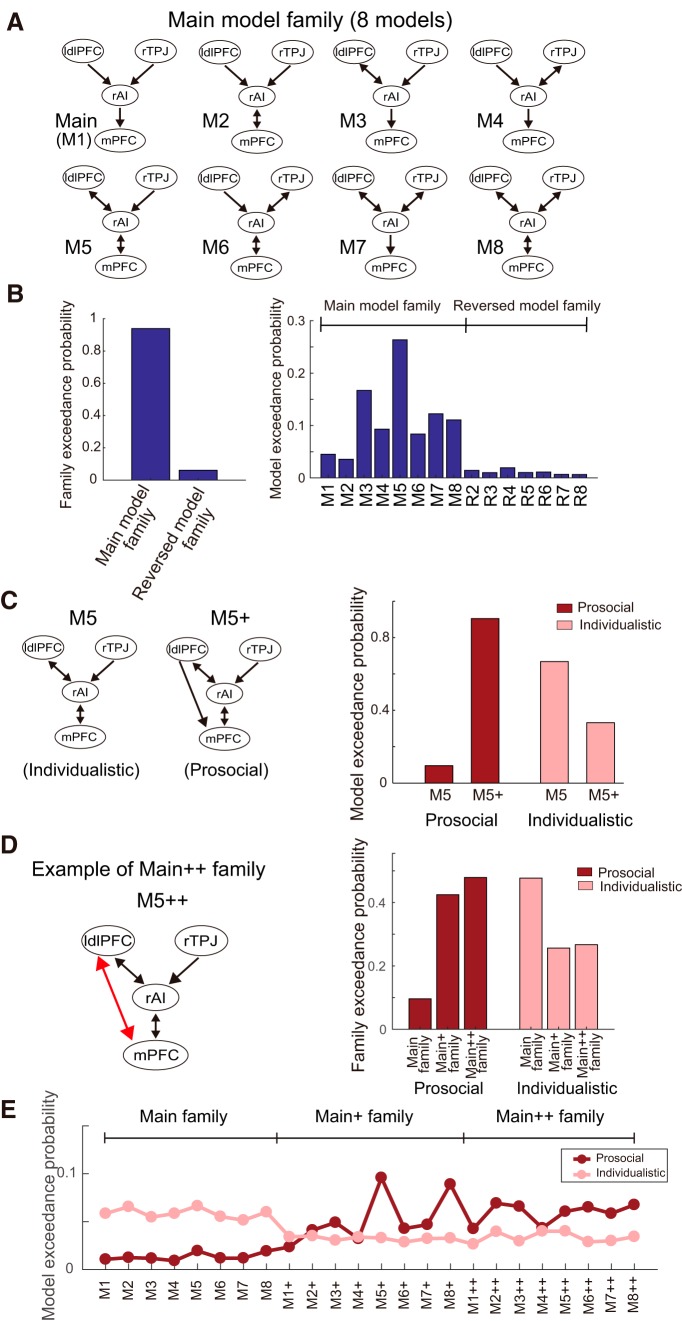
Social signals play powerful roles in shaping self-oriented reward valuation and decision making. These signals activate social and valuation/decision areas, but the core computation for their integration into the self-oriented decision machinery remains unclear. Here, we study how a fundamental social signal, social value (others' reward value), is converted into self-oriented decision making in the human brain. Using behavioral analysis, modeling, and neuroimaging, we show three-stage processing of social value conversion from the offer to the effective value and then to the final decision value. First, a value of others' bonus on offer, called offered value, was encoded uniquely in the right temporoparietal junction (rTPJ) and also in the left dorsolateral prefrontal cortex (ldlPFC), which is commonly activated by offered self-bonus value. The effective value, an intermediate value representing the effective influence of the offer on the decision, was represented in the right anterior insula (rAI), and the final decision value was encoded in the medial prefrontal cortex (mPFC). Second, using psychophysiological interaction and dynamic causal modeling analyses, we demonstrated three-stage feedforward processing from the rTPJ and ldPFC to the rAI and then from rAI to the mPFC. Further, we showed that these characteristics of social conversion underlie distinct sociobehavioral phenotypes. We demonstrate that the variability in the conversion underlies the difference between prosocial and selfish subjects, as seen from the differential strength of the rAI and ldlPFC coupling to the mPFC responses, respectively. Together, these findings identified fundamental neural computation processes for social value conversion underlying complex social decision making behaviors.SIGNIFICANCE STATEMENT In daily life, we make decisions based on self-interest, but also in consideration for others' status. These social influences modulate valuation and decision signals in the brain, suggesting a fundamental process called value conversion that translates social information into self-referenced decisions. However, little is known about the conversion process and its underlying brain mechanisms. We investigated value conversion using human fMRI with computational modeling and found three essential stages in a progressive brain circuit from social to empathic and decision areas. Interestingly, the brain mechanism of conversion differed between prosocial and individualistic subjects. These findings reveal how the brain processes and merges social information into the elemental flow of self-interested decision making.

Keywords: computational; decision making; fMRI; social preference; social value orientation; value.


Figures

Figure 1.
Figure 1.
Experimental task. A, Example of an other-bonus trial in the fMRI experiment. The subject was asked to choose between two options to maximize their reward gains. Here, the left option was chosen so the standard reward (i.e., the yellow number indicating the reward magnitude, 30 points) would be given with a probability indicated by the yellow bar at the top, and the other-bonus (20 points), indicated by the magenta number at the bottom, would be given to a charity. The accumulated payments for self and others were indicated by the yellow and magenta horizontal bars at the bottom for each trial, respectively. B, The main task was composed of other-bonus (magenta) and standard trials and the control task was composed of self-bonus (cyan) and standard trials. For display purpose, the color of numbers indicating other-bonus and self-bonus are shown in magenta and cyan, respectively, in the above figure; the actual experiment used red and green, respectively.
Figure 2.
Figure 2.
Behavioral results. A, The probability of choosing the option on the right side as a function of the standard value difference (ΔVs, right minus left) in the main and control tasks (left and right panels, respectively); the groupwise mean (the shaded region indicates the SE) is shown separately in each type of trial for different reward magnitudes (different line styles) and when the bonus was attached to the right or left option (different colors). B, Extent of behavioral change (mean and SE) in the other-bonus and self-bonus trials (magenta and cyan lines, respectively) versus reward magnitudes. The extent of change is derived by taking the difference in choice probability between the corresponding sigmoidal choice curve and that of the trial with zero additional reward at the indifference point (ΔVs = 0). *Significant increasing trend by Page's test: for, self-bonus trials, p < 0.001 and for other-bonus trials, p < 0.001. C, Behavioral weights from model fitting. *p < 0.001, significantly larger than zero or significantly different by group-level t tests; self-bonus: ws = 1.225 ± 0.471, t(42) = 17.041, p < 0.001; other-bonus: wo = 0.388 ± 0.367, t(42) = 6.939, p < 0.001; difference, t(42) = 10.824, p < 0.001, paired t test. For the box-plots, red lines in the boxes indicate the medians; the box limits indicate the top and bottom quartiles; the length of each whisker indicates 1.5 times the interquartile range; and the red dot indicates an outlier.
Figure 3.
Figure 3.
Signals for decision value, other-bonus value, and self-bonus value. A, Activation by DV (yellow) in the mPFC, which survived at the p < 0.05 level, FWE (whole brain)-corrected by a nonparametric method. For display, individual voxels in the activation map were first subjected to thresholding at p < 0.005 and then blurred at the resolution of anatomic imaging. The activation figures hereinafter were made in the same way unless stated otherwise. B, BOLD signal change (mean and SE) in the mPFC (extracted based on the ROI in A) in standard, self-bonus, and other-bonus trials as a function of the size of the DV, normalized within each trial type. *Significant increasing trend by Page's test: standard trial, p = 0.002; self-bonus trial, p < 0.001, and other-bonus trial, p = 0.008. C, rTPJ activation by offered other-bonus value (magenta). D, Activations by both other-bonus value (magenta) and self-bonus values (cyan) in the ldlPFC. E, rAI response to signed effective other-bonus value signals is significantly positively correlated with the behavioral weight for the other-bonus (wOi), which survived at the p < 0.05 level, FWE (whole brain)-corrected. F, Groupwise scatterplot between the weight of other-bonus and the rAI response for signed effective other-bonus value signals in the rAI ROI, based on leave-one-out cross-validated ROI analysis. The result showed a significant positive correlation, r = 0.384, p = 0.021, n = 36; p < 0.017 by bootstrap test. Each dot corresponds to a subject. See Table 3 for a summary of GLM activations.
Figure 4.
Figure 4.
PPI and DCM results for all subjects. A, PPI results for the rTPJ and dlPFC on the rAI and mPFC. Coupling with the rTPJ and ldlPFC responses (physiological seeds, derived from activation by the offered other-bonus value, Fig. 3C and D) as a function of the effectivity of the other-bonus value in the rAI responses (magenta, rTPJ seed; orange, ldlPFC seed) overlapped with the rAI activations (yellow, from Fig. 3E). Coupling with ldlPFC responses (physiological seed, derived from activation by the offered self-bonus value) as a function of offered self-bonus in the mPFC responses (cyan) overlapped with activation by the DV (yellow, from Fig. 3A). For display purposes, the activation identified by voxelwise PPI is shown as a whole cluster (uncorrected p < 0.005), including not only the activated voxels within the target ROI but also those in the surrounding region, and the significance of the activation is tested using SVC for only the activated voxels within the target ROI (all voxelwise PPI activations are at the p < 0.05 level, FWE [SVC]-corrected). The same methods for the SVC test and for display were used for Figure 7A. B, PPI results for the rAI to the mPFC. Coupling with rAI responses as a function of the signed effectivity of the other-bonus value on mPFC responses. Activated clusters identified by voxelwise PPI (red), indicated by the target in the panel, overlapped with the activation by the DV (yellow, derived from Fig. 3A). See Table 4 for a summary of PPI activations. C, DCM analysis supported three-stage processing; the structure shown in the figure was chosen as the best model by comparing exceedance probabilities among other models that had reversed connections over the brain regions (also see Fig. 5). Our DCM analysis included driving and modulatory inputs (derived from our findings for regional activations and connectivity, respectively), but for visibility, they were not shown in this and following figures (see Materials and Methods).
Figure 5.
Figure 5.
DCM model with feedforward connections compared with models having reversed connections. A, Main, the model with feedforward connections representing the three-stage processing for social value conversion shown in Figure 4C; R2–R8, alternative models that have possible reversed (feedback) connections between ROIs. B, Exceedance probabilities obtained by using random-effect Bayesian model selection indicated that the Main model is better than all of the models with the reversed connections (called the reversed family) at explaining the data.
Figure 6.
Figure 6.
rAI results for the prosocial and individualistic groups. A, Behavioral weight for the other-bonus distribution in each of the individualistic and prosocial subjects. Each dot corresponds to a subject. The weight for the other-bonus was not significantly different between prosocial and individualistic subjects (t(31) = 0.870, p = 0.391). However, for clarification, stars indicate the seven subjects whose choice behavior was insensitive to the other-bonus in our task (see “Model selection” section). The difference became significant (t(38) = 2.758, p = 0.009) when including the gray dots, that is, when including the seven subjects. This is reasonable because all seven subjects were also insensitive to others' reward in the SVO and were therefore classified as individualistic, thus lowering the average weight for the other-bonus of the individualistic subjects in this case. B, Reanalysis of rAI activation by signed effective other-bonus value (as indicated in Fig. 3E) separately for the prosocial and individualistic subjects (brown and pink); therefore, as a second-level analysis, multiple regression was performed on the rAI β sizes using the regressors of the constant (corresponding to the signed effective other-bonus value) and behavioral weights (covariates) in each SVO group; left, effect size of the covariate term; right panel, effect size of the constant term (error bar: SE); *p < 0.05, significantly larger than zero for each of covariate and constant effect and also significantly different between the two groups by group-level t tests.
Figure 7.
Figure 7.
PPI and DCM results for the prosocial and individualistic groups. A, PPI activations in the mPFC (by voxelwise analysis) overlapped with activation for the DV (yellow, from Fig. 3A): Pink, [rAI × signed effectivity of other-bonus value] for the individualistic group. Brown, [ldlPFC × offered other-bonus value] for the prosocial group. Cyan, [ldlPFC × offered self-bonus value] for both groups (similar to Fig. 4A, but with three unclassified subjects excluded). All voxelwise PPI activations are at the p < 0.05 level, FWE (SVC)-corrected. B, ROI PPI effect sizes in the mPFC indicated by mean and SE. *Significant effect of [rAI × signed effectivity of other-bonus value] for the individualistic group (pink, t(11) = 2.325, p = 0.040 by bootstrap test, p = 0.008, but n.s. for the prosocial group, brown, t(20) = 1.554, p = 0.136, bootstrap p = 0.096), and [ldlPFC × offered other-bonus value] for the prosocial group (t(20) = 2.722, p = 0.013, by bootstrap p = 0.004, but n.s. for the individualistic group, t(11) = −0.725, p = 0.484, by bootstrap p = 0.449). “inter,” Significant interaction effect (F = 6.278, p = 0.018) by 2 × 2 repeated-measures ANOVA for the SVO groups with the two brain regions (rAI and ldlPFC). C, Comparison of the impact between the two SVO groups, relative to that for the self-bonus. Effect sizes from PPI results for mPFC responses are plotted on a 2D map (mean and SE, by ROI PPI), separately for prosocial and individualistic subjects for the other-bonus and self-bonus values (reddish and greenish, respectively), with the rAI and ldlPFC cases shown on the horizontal and vertical axes. D, Based on the main model of our DCM analysis (left), a new DCM model was constructed with connectivity from the ldlPFC to the mPFC (right, indicated by Main+). Words in parentheses at the bottom are shown only for the ease of understanding in correspondence to the results in E. E, Exceedance probabilities obtained by using random-effect Bayesian model selection to indicate which of the two models fit better each SVO group; the model with dlPFC–mPFC connectivity (Main+) was better for the prosocial group, whereas the original main model (Main) was better for the individualistic group.
Figure 8.
Figure 8.
DCM models and results for difference between SVO groups. A, Main model family (eight models): M1, the main model representing the three-stage processing for social value conversion as shown in Figure 4C, and other 7 models (M2–M8) with possible bidirectional connections. B, Across all subjects, comparison of exceedance probabilities between the main model family vs the reversed model family (left) and comparison of all models of the two families (right). The reversed model family was composed of 7 models (R2–R8) with reversed connections (see Fig. 5A). The dataset is much better explained by the main model family and by model M5 in particular. C, Left, As in the analysis in Figure 7D and E, a new DCM model based on the model M5 was constructed with connectivity from the ldlPFC to the mPFC (M5+). Right, Exceedance probabilities obtained by using random-effect Bayesian model selection to indicate which of the two models better fit data of each SVO group; M5+ was better for the prosocial group, whereas M5 was better for the individualistic group. D, Left, One example (M5++) of the Main++ family. Right, Familywise comparison of fit for each SVO group among the three model families (Main, Main+, and Main++). The Main+ and Main++ model families were each composed of eight models corresponding to those of the main model family, in which feedforward and bidirectional connections were added between the ldlPFC and mPFC, respectively. The results indicate that Main+ and Main++ family were better than the Main family for the prosocial group, whereas the Main family was better for individualistic group. E, Exceedance probabilities obtained by using random-effect Bayesian model selection of all the models in the three families in each SVO group.

Similar articles

Cited by

References

    1. Adèr HJ, Mellenbergh GJ, Hand DJ (2008) Advising on research methods: a consultant's companion: Huizen, The Netherlands: Johannes van Kessel Publishing.
    1. Apps MA, Rushworth MF, Chang SW (2016) The anterior cingulate gyrus and social cognition: tracking the motivation of others. Neuron 90:692–707. 10.1016/j.neuron.2016.04.018 - DOI - PMC - PubMed
    1. Báez-Mendoza R, Harris CJ, Schultz W (2013) Activity of striatal neurons reflects social action and own reward. Proc Natl Acad Sci U S A 110:16634–16639. 10.1073/pnas.1211342110 - DOI - PMC - PubMed
    1. Baumgartner T, Knoch D, Hotz P, Eisenegger C, Fehr E (2011) Dorsolateral and ventromedial prefrontal cortex orchestrate normative choice. Nat Neurosci 14:1468–1474. 10.1038/nn.2933 - DOI - PubMed
    1. Behrens TE, Hunt LT, Woolrich MW, Rushworth MF (2008) Associative learning of social value. Nature 456:245–249. 10.1038/nature07538 - DOI - PMC - PubMed

Publication types

LinkOut - more resources