. 2019 May 7;116(19):9400-9409.
doi: 10.1073/pnas.1900778116. Epub 2019 Apr 18.

Forging tools for refining predicted protein structures

Affiliations

Forging tools for refining predicted protein structures

Xingcheng Lin et al. Proc Natl Acad Sci U S A. .

Abstract

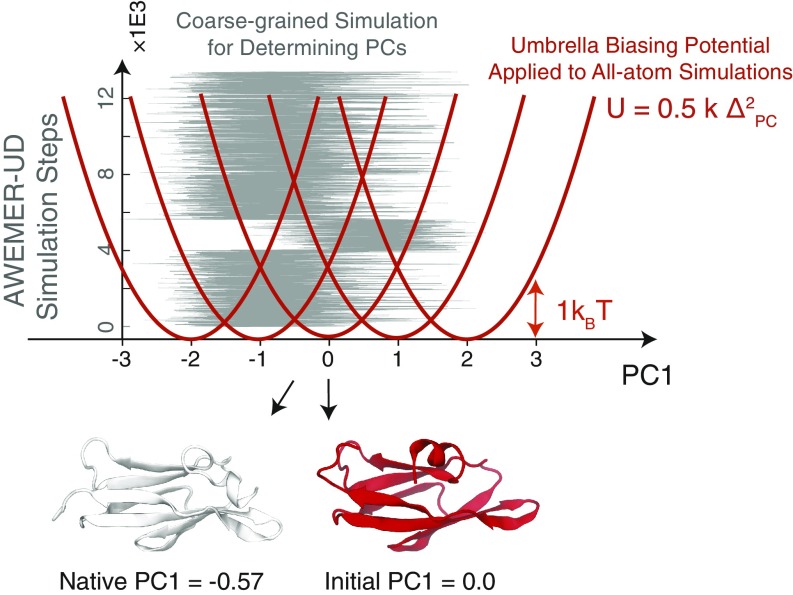
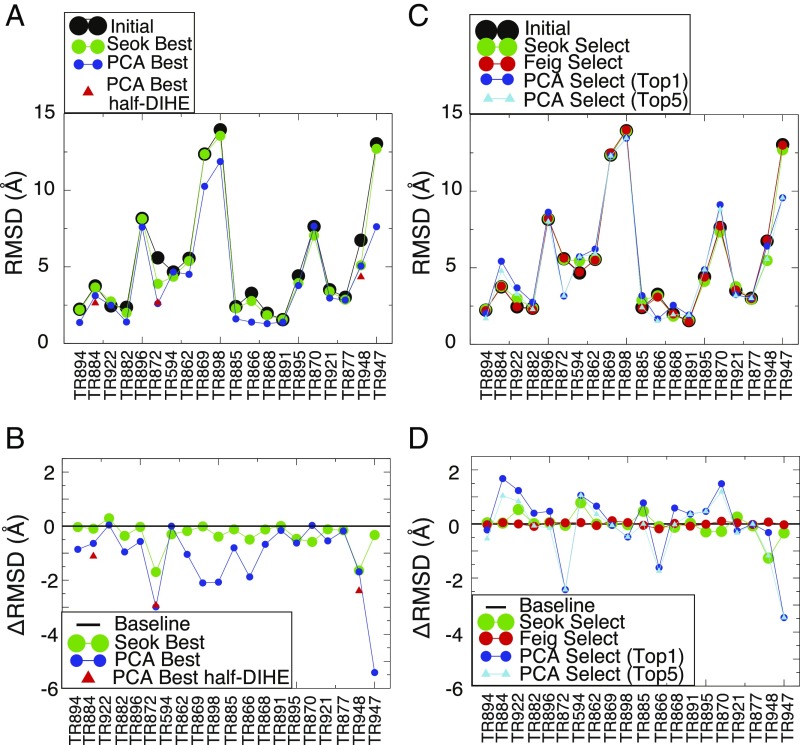
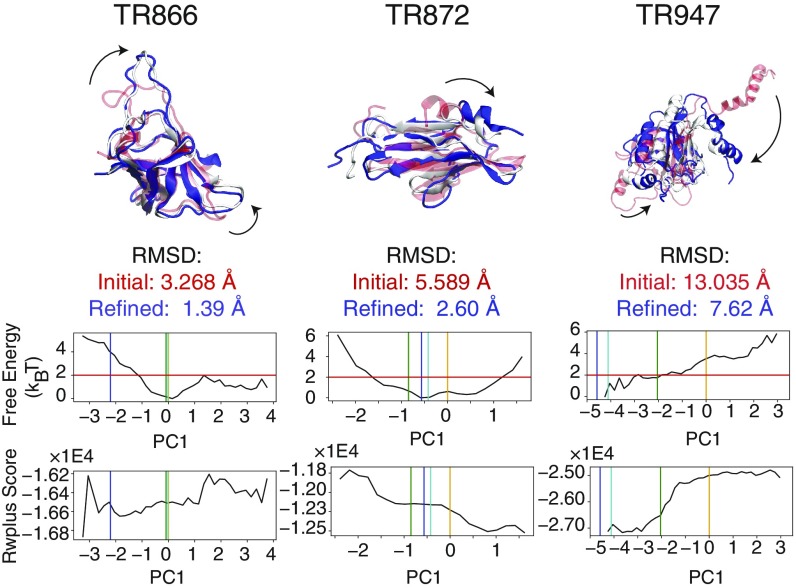
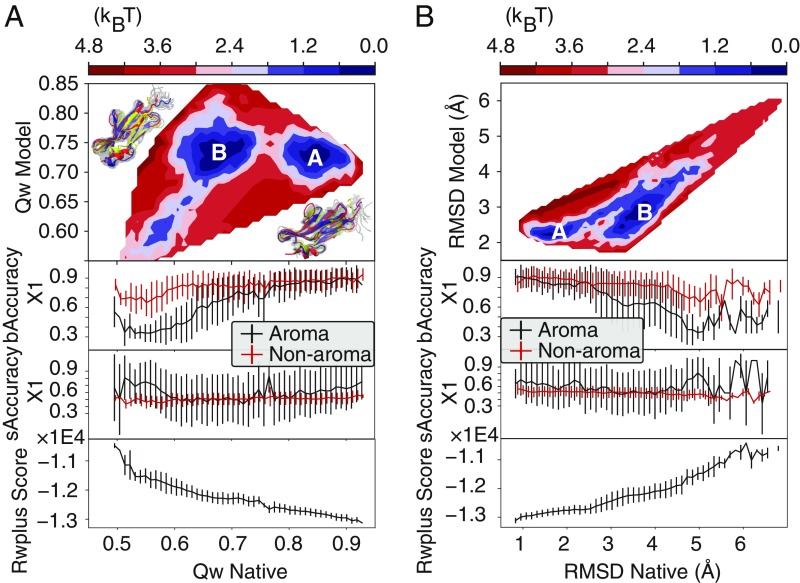
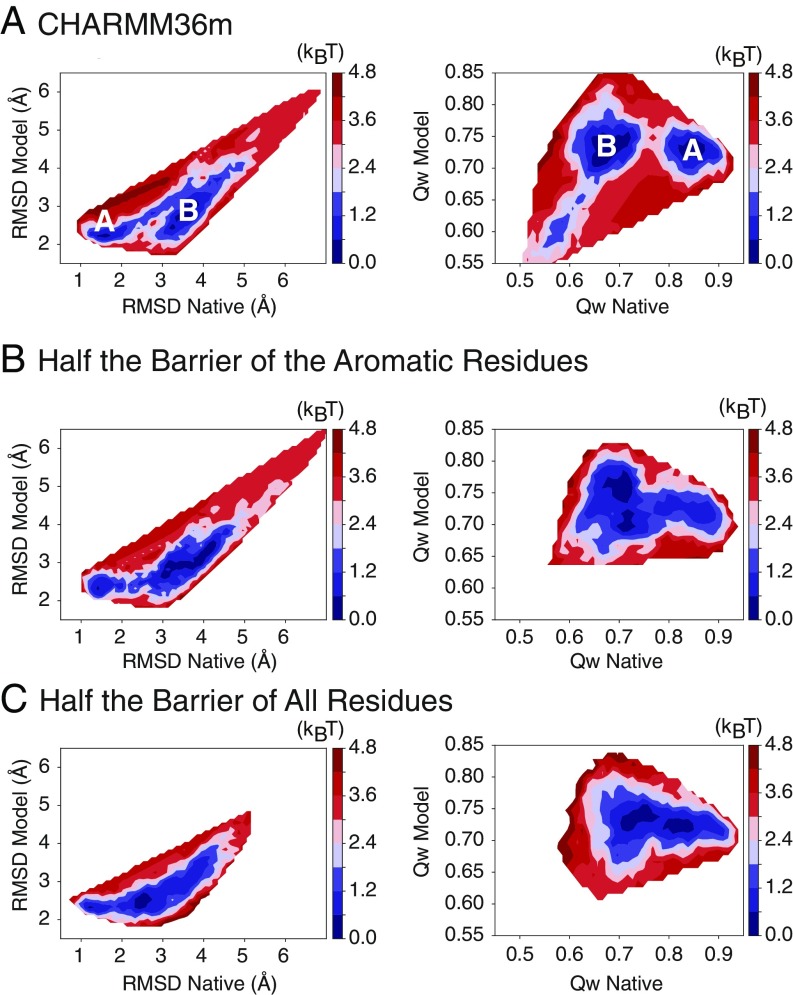
Refining predicted protein structures with all-atom molecular dynamics simulations is one route to producing, entirely by computational means, structural models of proteins that rival in quality those that are determined by X-ray diffraction experiments. Slow rearrangements within the compact folded state, however, make routine refinement of predicted structures by unrestrained simulations infeasible. In this work, we draw inspiration from the fields of metallurgy and blacksmithing, where practitioners have worked out practical means of controlling equilibration by mechanically deforming their samples. We describe a two-step refinement procedure that involves identifying collective variables for mechanical deformations using a coarse-grained model and then sampling along these deformation modes in all-atom simulations. Identifying those low-frequency collective modes that change the contact map the most proves to be an effective strategy for choosing which deformations to use for sampling. The method is tested on 20 refinement targets from the CASP12 competition and is found to induce large structural rearrangements that drive the structures closer to the experimentally determined structures during relatively short all-atom simulations of 50 ns. By examining the accuracy of side-chain rotamer states in subensembles of structures that have varying degrees of similarity to the experimental structure, we identified the reorientation of aromatic side chains as a step that remains slow even when encouraging global mechanical deformations in the all-atom simulations. Reducing the side-chain rotamer isomerization barriers in the all-atom force field is found to further speed up refinement.

Keywords: mechanical deformations; principal component analysis; protein blacksmithing; protein structure refinement; side-chain isomerization.


Conflict of interest statement

The authors declare no conflict of interest.

Figures

Fig. 1.
Fig. 1.
Summary of the PC-guided refinement protocol used in this study. The refinement protocol includes a coarse-grained modeling step for determining the mechanical deformations to be made in an all-atom refinement step where the molecule is distorted mechanically. The coarse-grained AWSEM with evolutionary restraints from ultradeep learning (AWSEMER-UD) potential (11) was simulated at a constant temperature of 300 K starting from the initial model structure taken from the CASP12 repository. The coarse-grained trajectory is then used to find the principal components of the backbone motions. A single principal component was then chosen from among those with the largest eigenvalues according to the effect of its motion on the change in the number of contacts (see Materials and Methods for details). These motions would require cracking. The variations of the selected principal component’s value during the constant temperature trajectory are shown in gray. In the five subsequent all-atom explicit-solvent refinement simulations, an umbrella potential was applied to sample along the selected principal component. The reference points of the harmonic biasing potentials were chosen to range from −2 to 2 in units of the SD of principal component values sampled during the coarse-grained AWSEMER-UD simulation. Bottom shows the native and the initial structures with their corresponding principal component values.
Fig. 2.
Fig. 2.
Summary of the refinement results. (A) The rmsd values of the initial structures (black), the refined structures with the lowest rmsd from the “Seok” group (“Seok Best,” green) (29), and the structures with the lowest rmsd using the AWSEM-PCA protocol (“PCA Best,” blue). Additionally, the lowest rmsd sampled in the simulations of three targets (TR884, TR872, and TR948) where the side-chain barriers were reduced by half [PCA Best half-DIHE (dihedral)] are marked in red triangles. (B) The difference in rmsd values (Δrmsd; note it is the opposite of the values of −Δrmsd shown in Table 1) between the initial structures and those in Seok Best (green), the PCA Best (blue), and the “PCA Best half-DIHE” (red). A black line is drawn at the value of Δrmsd=0 as a guide for the eye. (C) The rmsd values of the initial structures (black), the blindly selected structures from the Seok group (green), the “Feig” group (red) (30), PC-guided refinement (“PCA Select (Top1),” blue), and the lowest rmsd structure of the top five selections (“PCA Select (Top5),” cyan). (D) The difference in rmsd values between the initial structures and those in the Seok (green), the Feig (red), the PCA Select (Top1) (blue), and the PCA Select (Top5) (cyan) groups. A black line is shown at Δrmsd = 0 as a guide for the eye.
Fig. 3.
Fig. 3.
Three examples of the conformational changes upon refinement where PC-guided refinement improves the structure significantly: TR866, TR872, and TR947. (Top) In all of these cases, the initial structures (transparent red) have at least one domain that undergoes a significant structural transition (indicated by the arrows). These transitions are encouraged by the PC-guiding potentials. The resulting refined structures are shown in blue. The corresponding experimentally determined structures are shown in white. The structural representations of the complete list of proteins in this study are shown in Figure S7. (Bottom) The reweighted free-energy profiles as a function of the selected principal component are plotted for each set of refinement simulations. The vertical orange, green, cyan, and blue bars indicate the principal component values of the initial, top 1 selected, lowest rmsd, and experimentally determined structures, respectively. The horizontal red line indicates the relative free-energy threshold of 2kBT from the most probable value of the principal component according to the reweighting of the refinement simulations. In the structure selection scheme, we first applied a “free-energy filter,” which selects structures with PC values in the regions below this 2kBT threshold. The expectation value of the all-atom statistical potential RWplus (31) is plotted as a function of the principal component value (Bottom).
Fig. 4.
Fig. 4.
Free-energy surfaces constructed from the Qdiff umbrella sampling of TR872. The surfaces are shown with two types of reaction coordinates: rmsds (A) and Qw values (B). Each surface is shown as a function of similarity to both the model structure and the native structure. (A and B, Top) There is an apparent barrier between the basins closest to the experimentally determined structure (basin A) and those closest to the model structure (basin B). (A and B, Middle) The average and the SD of the side-chain accuracy for the buried and surface-exposed residues calculated as a function of these same reaction coordinates. These are shown separately for aromatic residues and for nonaromatic residues. (A and B, Bottom) The expectation value and the SD of the all-atom statistical potential, RWplus, calculated as a function of these same reaction coordinates.
Fig. 5.
Fig. 5.
Reducing the side-chain dihedral barriers reduces the apparent free-energy barrier between the model structure and the experimental structure. (A–C) The free energy constructed from the Qdiff thermodynamic sampling of TR872 using (A) the CHARMM36m force field, (B) the CHARMM36m force field with the side-chain dihedral barriers of aromatic residues reduced by half, and (C) the CHARMM36m force field with the side-chain dihedral barriers of all residues reduced by half. The apparent free-energy profiles are shown as a function of two types of reaction coordinates, rmsd (A–C, Left) and Qw (A–C, Right). The reduction of the side-chain barriers of aromatic residues reduces most of the apparent free-energy barrier toward the native state that was seen in the full-barrier simulations, while reducing the side-chain barriers of all residue types essentially eliminates the barrier.

References

    1. Rohl CA, Strauss CE, Misura KM, Baker D. Protein structure prediction using Rosetta. Methods Enzymol. 2004;383:66–93. - PubMed
    1. Yang J, et al. The I-TASSER suite: Protein structure and function prediction. Nat Methods. 2015;12:7–8. - PMC - PubMed
    1. Chen M, et al. Template-guided protein structure prediction and refinement using optimized folding landscape force fields. J Chem Theory Comput. 2018;14:6102–6116. - PMC - PubMed
    1. Källberg M, et al. Template-based protein structure modeling using the RaptorX web server. Nat Protoc. 2012;7:1511–1522. - PMC - PubMed
    1. Bohr HG, Wolynes PG. Initial events of protein folding from an information-processing viewpoint. Phys Rev A. 1992;46:5242–5248. - PubMed

Publication types

LinkOut - more resources