. 2019 Apr 18;10(1):1815.
doi: 10.1038/s41467-019-09787-6.

Hierarchical self-assembly of 3D lattices from polydisperse anisometric colloids

Affiliations

Hierarchical self-assembly of 3D lattices from polydisperse anisometric colloids

Binbin Luo et al. Nat Commun. .

Abstract

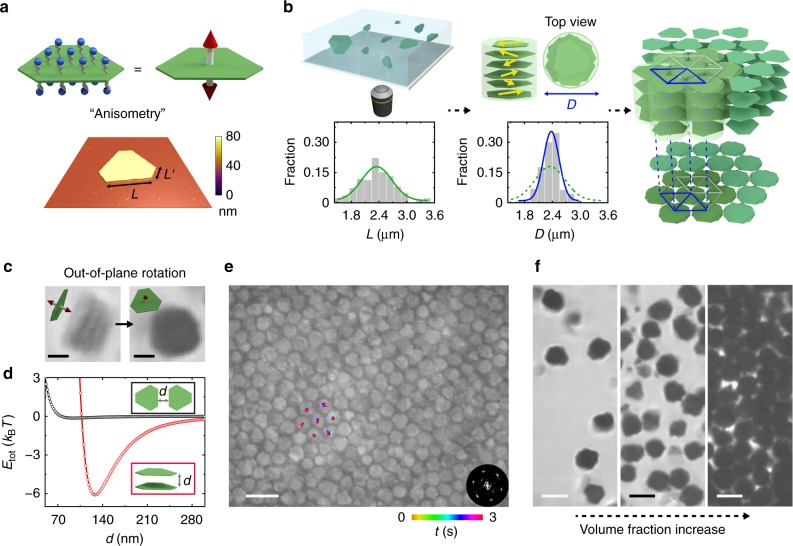
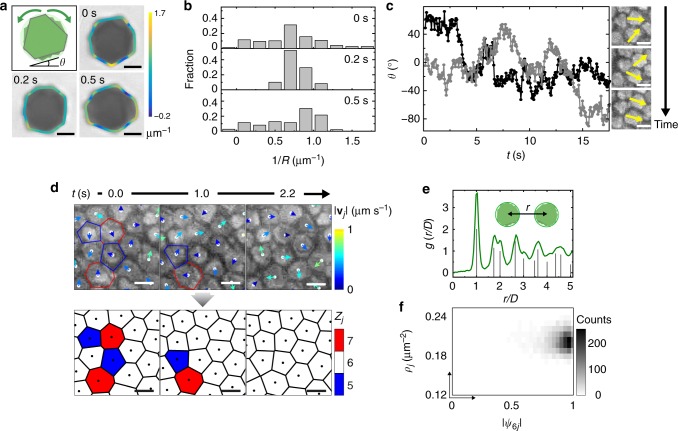
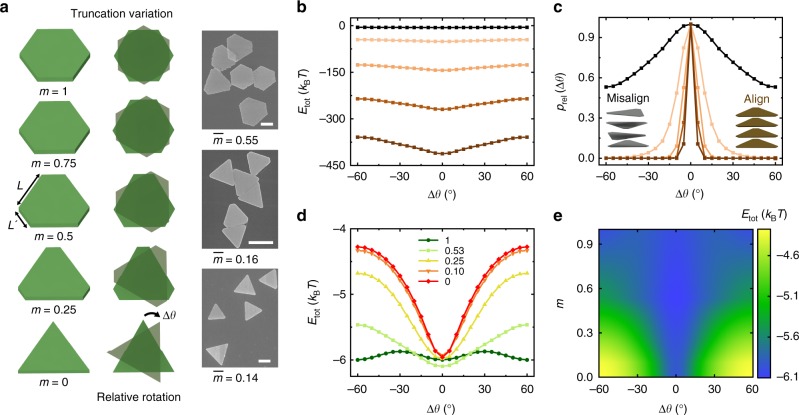
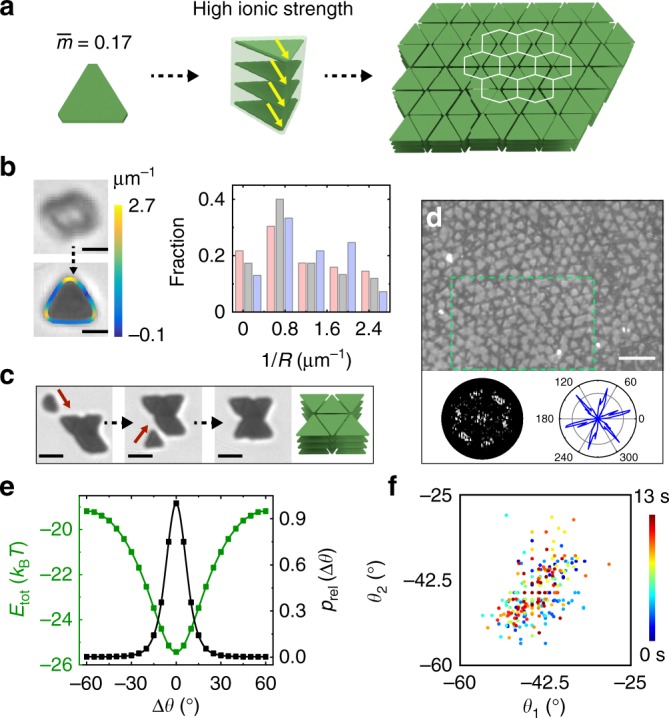
Colloids are mainly divided into two types defined by size. Micron-scale colloids are widely used as model systems to study phase transitions, while nanoparticles have physicochemical properties unique to their size. Here we study a promising yet underexplored third type: anisometric colloids, which integrate micrometer and nanometer dimensions into the same particle. We show that our prototypical system of anisometric silver plates with a high polydispersity assemble, unexpectedly, into an ordered, three-dimensional lattice. Real-time imaging and interaction modeling elucidate the crucial role of anisometry, which directs hierarchical assembly into secondary building blocks-columns-which are sufficiently monodisperse for further ordering. Ionic strength and plate tip morphology control the shape of the columns, and therefore the final lattice structures (hexagonal versus honeycomb). Our joint experiment-modeling study demonstrates potentials of encoding unconventional assembly in anisometric colloids, which can likely introduce properties and phase behaviors inaccessible to micron- or nanometer-scale colloids.


Conflict of interest statement

The authors declare no competing interests.

Figures

Fig. 1
Fig. 1
Hierarchical self-assembly of polydisperse, anisometric plates into a 3D lattice. a Top: schematics of anisometric silver plates (green) coated with thiolated COO ligands (blue) and their directional attractions (red arrows). Bottom: a representative atomic force microscopy (AFM) scan over an anisometric plate. The color bar represents height. Scan area: 5 µm × 5 µm. b Schematics describing the hierarchical building process: plates first stack into columns (yellow arrows denoting the random orientations of the plates), which then assemble into a hexagonal lattice. The graphs below show the distribution of the long side length L of plates (left, green curve) and that of column projection diameter D (right, blue curve). The L distribution was rescaled so that L¯ and D¯ have the same value (2.36 µm) for direct comparison. c Time-lapse optical microscopy images and schematics showing the lying and standing orientations of the same rotating column. d Theoretical calculations of the net pairwise interactions Etot of two plates in the face-to-face (red circles) and side-by-side (black circles) configurations as a function of the plate‒plate distance d (labeled in inset schematic). e An optical microscopy image showing a hexagonal lattice, overlaid with tracked trajectories of the central positions of the column projections. The image was processed as detailed in Supplementary Fig. 5 and Supplementary Note 4. The bottom right inset is a fast Fourier transform (FFT) pattern of the image. f Optical microscopy images showing column arrangements as their concentration increases (from left to right). Ionic strength in cf: 0.5 mM. The schematics were not drawn to scale. Scale bars: 1 µm in c; 5 µm in e; 3 µm in f
Fig. 2
Fig. 2
Radially symmetric columns assembled from triangular plates. a Schematic and time-lapse optical microscopy images of the projections of the same column, overlaid with contour lines color-coded according to the local curvature (the inverse of the locally fitted circle radius R). The color bar represents curvature values. The first-layer plate’s orientation θ is defined as the angle of one long side of the plate relative to the horizontal axis. b The distribution of local curvature of the projection contours tracked at 0, 0.2, and 0.5 s in a. c Orientations of two plates (one in gray, the other in black) in a pair of nearest neighbor columns inside the lattice over time, and time-lapse optical microscopy images with the plate orientations labeled in yellow. The measurement errors are ±5°. d Time-lapse optical microscopy images (top) and corresponding Voronoi cell representations (bottom) of the hexagonal lattice, showing the annealing of imperfectly coordinated sites. The arrows in the top panel are color-coded by the velocity magnitude |vj| of columns calculated over a period of 0.7 s (12 frames). The color of each Voronoi cell denotes the number of nearest neighbors Zj per column j. e Radial distribution function of the lattice in experiment (green curve) and that of an ideal hexagonal lattice (gray lines). The inset defines the center-to-center distance r between columns. A D value of 2.36 µm is used in the plot. f The local order–local density (ψ6j,ρj) histogram based on single column tracking of the hexagonal lattice (32 frames in Supplementary Movie 3). Here ψ6j=1Zjk=1Zj exp(6iβjk), where the summation goes over all the nearest neighbors of column j, and βjk is the angle between the bond linking column j and its kth neighbor and an arbitrary reference axis,. Ionic strength: 0.5 mM. Scale bars: 1 µm in a; 2 µm in c, d
Fig. 3
Fig. 3
The effective shape of columns modulated by ionic strength or plate tip truncation. a Schematics (left) and SEM images (right) showing plates of a systematically varying extent of truncation (defined as L′/L). The top right SEM image shows the plates used in the hexagonal lattice. The corresponding truncation distributions are shown in Supplementary Fig. 13. Scale bars: 1 µm. b A graph showing how the computed pairwise interaction Etot between two stacked plates (m = L¯L¯ = 0.53, corresponding to the plates used for hexagonal lattice) changes as a function of Δθ at different ionic strengths (from top to bottom: 0.5, 1, 1.5, 2, and 2.5 mM, respectively). Note that 0.5 mM is used in the hexagonal lattice assembly. c Relative probability distributions of Δθ based on a Boltzmann distribution argument at different ionic strengths, computed from the interaction energy plot in b (color coded the same as in b). The inset schematics show misaligned plate orientations inside column (left) at low ionic strength (0.5 mM) and well-aligned plate orientations (right) at high ionic strength (2.5 mM). d A graph showing how the computed pairwise interaction Etot between two stacked plates changes as a function of Δθ at different extent of truncation m as labeled. Here the calculations are conducted at a fixed basal plane area (3.27 µm2). Ionic strength: 0.5 mM. e Pairwise interaction strength as a function of Δθ and truncation m at their energy minimum spacing d. Ionic strength: 0.5 mM
Fig. 4
Fig. 4
Experimental observation of plates assembling into 3D honeycomb lattice domains. a Schematics showing the hierarchical self-assembly process. The plates here have the dimensions, L: 1.28 ± 0.27 µm; L′: 0.19 ± 0.19 µm; tplate: 22 ± 2 nm; m¯ = 0.17. The yellow arrows denote the aligned plate orientations in the column. b Time-lapse optical microscopy images (left) showing the lying and standing orientations of the same rotating column. The bottom image is overlaid with contours color-coded according to local curvature. The color bar represents curvature values. The right plot shows the local curvature distributions of the standing column projection contours over time (pink: 0 s; gray: 1 s; purple: 1.5 s). Ionic strength: 3.2 mM. c Time-lapse optical microscopy images and schematic showing the assembly process of the columns into a “hexamer”. d An optical microscopy image of the assembled lattice with multiple ordered honeycomb domains. The image was processed following details in Supplementary Fig. 5. The bottom left image is an FFT of one honeycomb lattice domain in the green box. The bottom right plot is an orientation distribution map of the plates in the same lattice domain. e Pairwise interaction (green curve) and relative probability distribution normalized to Δθ = 0° (black curve) of the two stacked plates as a function of plate relative orientation Δθ. f A scatter plot showing the orientations of two plates in a nearest neighbor pair in the honeycomb domain over time. Each data point color corresponds to a different time. The measurement errors are ±2°. The color bar represents time. Ionic strengths in cf: 3.5 mM. Scale bars: 1 µm in b; 2 µm in c; 5 µm in d

Similar articles

Cited by

References

    1. Liu JW, Liang HW, Yu SH. Macroscopic-scale assembled nanowire thin films and their functionalities. Chem. Rev. 2012;112:4770–4799. doi: 10.1021/cr200347w. - DOI - PubMed
    1. Luo B, et al. Polymerization-like co-assembly of silver nanoplates and patchy spheres. ACS Nano. 2017;11:7626–7633. doi: 10.1021/acsnano.7b02059. - DOI - PubMed
    1. Vutukuri HR, Badaire S, de Winter DAM, Imhof A, van Blaaderen A. Directed self-assembly of micron-sized gold nanoplatelets into oriented flexible stacks with tunable interplate distance. Nano Lett. 2015;15:5617–5623. doi: 10.1021/acs.nanolett.5b02384. - DOI - PubMed
    1. Minary-Jolandan M, Yu MF. Nanomechanical heterogeneity in the gap and overlap regions of type I collagen fibrils with implications for bone heterogeneity. Biomacromolecules. 2009;10:2565–2570. doi: 10.1021/bm900519v. - DOI - PubMed
    1. Schmidt V, Wittemann Joerg V, Senz S, Gösele U. Silicon nanowires: a review on aspects of their growth and their electrical properties. Adv. Mater. 2009;21:2681–2702. doi: 10.1002/adma.200803754. - DOI - PubMed

Publication types