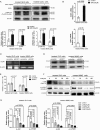
Bromocriptine and cabergoline induce cell death in prolactinoma cells via the ERK/EGR1 and AKT/mTOR pathway respectively
- PMID: 31000722
- PMCID: PMC6472389
- DOI: 10.1038/s41419-019-1526-0
Bromocriptine and cabergoline induce cell death in prolactinoma cells via the ERK/EGR1 and AKT/mTOR pathway respectively
Abstract
The treatment of hyperprolactinemia is based on the use of dopamine agonists, mainly bromocriptine (BRC) and cabergoline (CAB). They reduce tumour size effectively and restore gonadal function. However, there is a difference in drug sensitivity between CAB and BRC in patients with prolactinoma, although the underlying mechanisms are still unknown. Thus, we investigated whether there are differences in tumour sensitivity to CAB and BRC and their possible differential mechanisms in two prolactinoma cell lines. In our study, we found that GH3 cells are more sensitive to BRC and that MMQ cells are more sensitive to CAB. Moreover, BRC and CAB elicited cell death via different pathways; BRC induced prolactinoma cell death mainly through the apoptosis pathway, and CAB induced pituitary prolactinoma cell death mainly via the autophagic cell death pathway. Using gene microarray analysis, we found that BRC induces the apoptosis of prolactinoma cells through the ERK/EGR1 signalling pathway, whereas CAB induces autophagic death by inhibiting the AKT/mTOR signalling pathway. Our study showed the difference in tumour sensitivity and differential mechanisms in BRC- and CAB-treated prolactinoma cells, which provides a theoretical basis for the accurate treatment of prolactinoma.
Conflict of interest statement
The authors declare that they have no conflict of interest.
Figures


Similar articles
-
Curcumin Sensitizes Prolactinoma Cells to Bromocriptine by Activating the ERK/EGR1 and Inhibiting the AKT/GSK-3β Signaling Pathway In Vitro and In Vivo.Mol Neurobiol. 2021 Dec;58(12):6170-6185. doi: 10.1007/s12035-021-02541-4. Epub 2021 Aug 31. Mol Neurobiol. 2021. PMID: 34463926
-
ACT001 reverses resistance of prolactinomas via AMPK-mediated EGR1 and mTOR pathways.Endocr Relat Cancer. 2021 Dec 13;29(2):33-46. doi: 10.1530/ERC-21-0215. Endocr Relat Cancer. 2021. PMID: 34821219
-
Cabergoline-induced NDFIP1 upregulation in pituitary neuroendocrine tumor cells activates mTOR signaling and contributes to cabergoline resistance.J Neurooncol. 2025 May;172(3):587-597. doi: 10.1007/s11060-025-04949-7. Epub 2025 Feb 1. J Neurooncol. 2025. PMID: 39891847 Free PMC article.
-
Cabergoline versus bromocriptine for the treatment of giant prolactinomas: A quantitative and systematic review.Metab Brain Dis. 2018 Jun;33(3):969-976. doi: 10.1007/s11011-018-0217-3. Epub 2018 Mar 15. Metab Brain Dis. 2018. PMID: 29546691
-
Prolactinomas, cabergoline, and pregnancy.Endocrine. 2014 Sep;47(1):64-9. doi: 10.1007/s12020-014-0334-7. Epub 2014 Jul 2. Endocrine. 2014. PMID: 24985062 Review.
Cited by
-
The Role of Activation of PI3K/AKT/mTOR and RAF/MEK/ERK Pathways in Aggressive Pituitary Adenomas-New Potential Therapeutic Approach-A Systematic Review.Int J Mol Sci. 2023 Jun 30;24(13):10952. doi: 10.3390/ijms241310952. Int J Mol Sci. 2023. PMID: 37446128 Free PMC article.
-
Sini San ameliorates lipid metabolism in hyperprolactinemia rat with liver-depression.Curr Res Food Sci. 2024 Sep 14;9:100853. doi: 10.1016/j.crfs.2024.100853. eCollection 2024. Curr Res Food Sci. 2024. PMID: 39328388 Free PMC article.
-
Recent Advances in Treatment of Recurrent Spontaneous Abortion.Obstet Gynecol Surv. 2022 Jun;77(6):355-366. doi: 10.1097/OGX.0000000000001033. Obstet Gynecol Surv. 2022. PMID: 35672876 Free PMC article. Review.
-
Resistance to Dopamine Agonists in Pituitary Tumors: Molecular Mechanisms.Front Endocrinol (Lausanne). 2022 Jan 12;12:791633. doi: 10.3389/fendo.2021.791633. eCollection 2021. Front Endocrinol (Lausanne). 2022. PMID: 35095761 Free PMC article. Review.
-
Curcumin Sensitizes Prolactinoma Cells to Bromocriptine by Activating the ERK/EGR1 and Inhibiting the AKT/GSK-3β Signaling Pathway In Vitro and In Vivo.Mol Neurobiol. 2021 Dec;58(12):6170-6185. doi: 10.1007/s12035-021-02541-4. Epub 2021 Aug 31. Mol Neurobiol. 2021. PMID: 34463926
References
Publication types
MeSH terms
Substances
LinkOut - more resources
Full Text Sources
Miscellaneous

