

Efficient Deep Network Architectures for Fast Chest X-Ray Tuberculosis Screening and Visualization
- PMID: 31000728
- PMCID: PMC6472370
- DOI: 10.1038/s41598-019-42557-4
Efficient Deep Network Architectures for Fast Chest X-Ray Tuberculosis Screening and Visualization
Abstract
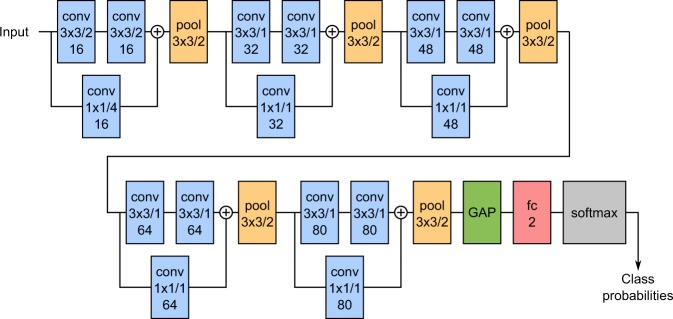
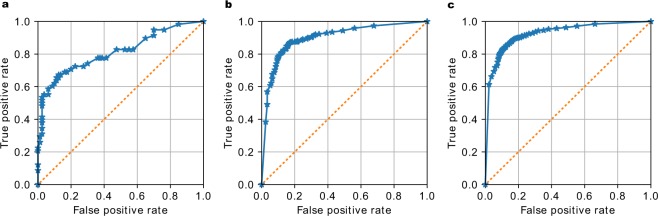
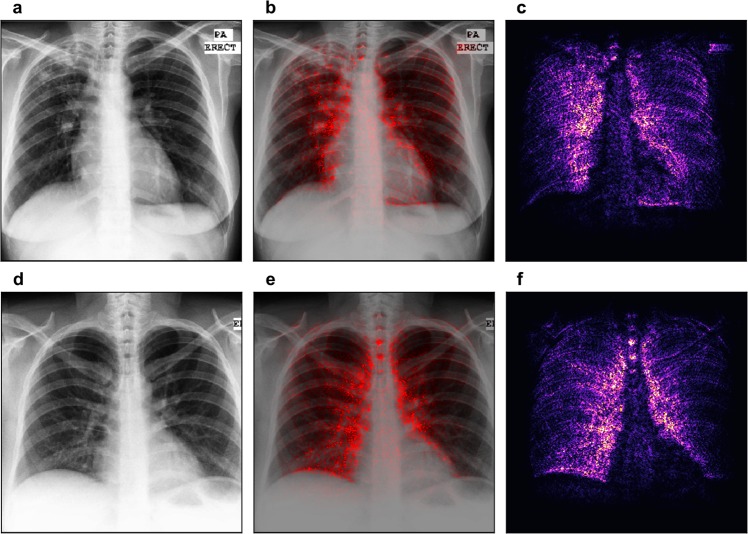
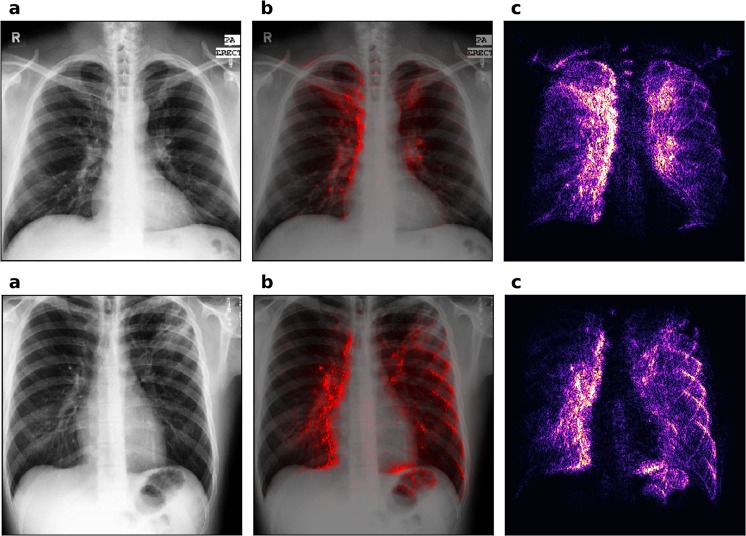
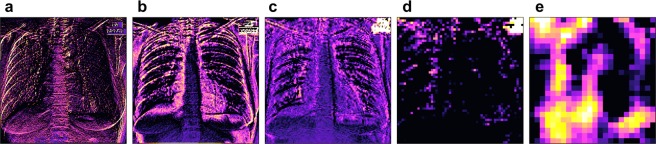
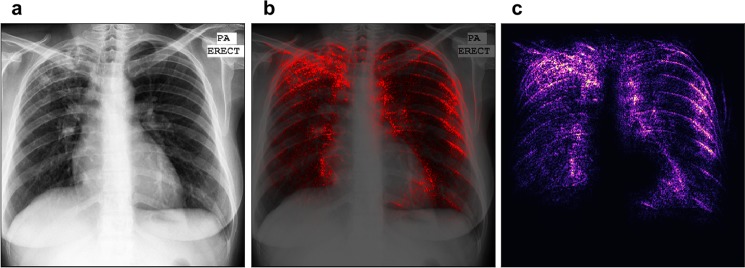
Automated diagnosis of tuberculosis (TB) from chest X-Rays (CXR) has been tackled with either hand-crafted algorithms or machine learning approaches such as support vector machines (SVMs) and convolutional neural networks (CNNs). Most deep neural network applied to the task of tuberculosis diagnosis have been adapted from natural image classification. These models have a large number of parameters as well as high hardware requirements, which makes them prone to overfitting and harder to deploy in mobile settings. We propose a simple convolutional neural network optimized for the problem which is faster and more efficient than previous models but preserves their accuracy. Moreover, the visualization capabilities of CNNs have not been fully investigated. We test saliency maps and grad-CAMs as tuberculosis visualization methods, and discuss them from a radiological perspective.
Conflict of interest statement
The authors declare no competing interests.
Figures
Similar articles
-
Issues associated with deploying CNN transfer learning to detect COVID-19 from chest X-rays.Phys Eng Sci Med. 2020 Dec;43(4):1289-1303. doi: 10.1007/s13246-020-00934-8. Epub 2020 Oct 6. Phys Eng Sci Med. 2020. PMID: 33025386 Free PMC article.
-
An automatic method for lung segmentation and reconstruction in chest X-ray using deep neural networks.Comput Methods Programs Biomed. 2019 Aug;177:285-296. doi: 10.1016/j.cmpb.2019.06.005. Epub 2019 Jun 6. Comput Methods Programs Biomed. 2019. PMID: 31319957
-
Computer-Aided System for the Detection of Multicategory Pulmonary Tuberculosis in Radiographs.J Healthc Eng. 2020 Aug 24;2020:9205082. doi: 10.1155/2020/9205082. eCollection 2020. J Healthc Eng. 2020. PMID: 32908660 Free PMC article.
-
Machine and Deep Learning for Tuberculosis Detection on Chest X-Rays: Systematic Literature Review.J Med Internet Res. 2023 Jul 3;25:e43154. doi: 10.2196/43154. J Med Internet Res. 2023. PMID: 37399055 Free PMC article.
-
Deep learning for report generation on chest X-ray images.Comput Med Imaging Graph. 2024 Jan;111:102320. doi: 10.1016/j.compmedimag.2023.102320. Epub 2023 Dec 14. Comput Med Imaging Graph. 2024. PMID: 38134726 Review.
Cited by
-
Predicting pattern of coronavirus using X-ray and CT scan images.Netw Model Anal Health Inform Bioinform. 2022;11(1):39. doi: 10.1007/s13721-022-00382-2. Epub 2022 Oct 5. Netw Model Anal Health Inform Bioinform. 2022. PMID: 36212780 Free PMC article.
-
Detecting Tuberculosis-Consistent Findings in Lateral Chest X-Rays Using an Ensemble of CNNs and Vision Transformers.Front Genet. 2022 Feb 24;13:864724. doi: 10.3389/fgene.2022.864724. eCollection 2022. Front Genet. 2022. PMID: 35281798 Free PMC article.
-
The Application of Artificial Intelligence in the Diagnosis and Drug Resistance Prediction of Pulmonary Tuberculosis.Front Med (Lausanne). 2022 Jul 28;9:935080. doi: 10.3389/fmed.2022.935080. eCollection 2022. Front Med (Lausanne). 2022. PMID: 35966878 Free PMC article. Review.
-
Assessment of the effect of a comprehensive chest radiograph deep learning model on radiologist reports and patient outcomes: a real-world observational study.BMJ Open. 2021 Dec 20;11(12):e052902. doi: 10.1136/bmjopen-2021-052902. BMJ Open. 2021. PMID: 34930738 Free PMC article.
-
Prediction of future healthcare expenses of patients from chest radiographs using deep learning: a pilot study.Sci Rep. 2022 May 18;12(1):8344. doi: 10.1038/s41598-022-12551-4. Sci Rep. 2022. PMID: 35585177 Free PMC article.
References
-
- Anderson L, et al. WHO Global tuberculosis report 2015. WHO Libr. Cat. Data. 2015;1:1689–1699.
-
- Hwang S, Kim H, Jeong J, Kim H. A Novel Approach for Tuberculosis Screening Based on Deep Convolutional Neural Networks. Proc. SPIE. 2016;9785:1–8.
Publication types
MeSH terms
LinkOut - more resources
Full Text Sources
Other Literature Sources
Medical
