. 2019 Apr 18;9(1):6273.
doi: 10.1038/s41598-019-42731-8.

Abiotic and biotic stresses induce a core transcriptome response in rice

Affiliations

Abiotic and biotic stresses induce a core transcriptome response in rice

Stephen P Cohen et al. Sci Rep. .

Abstract

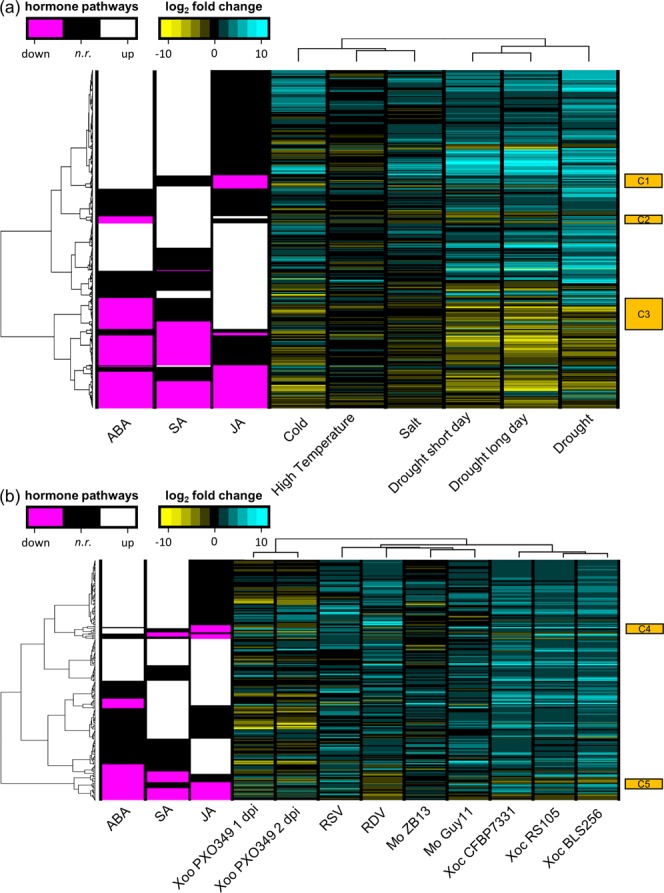
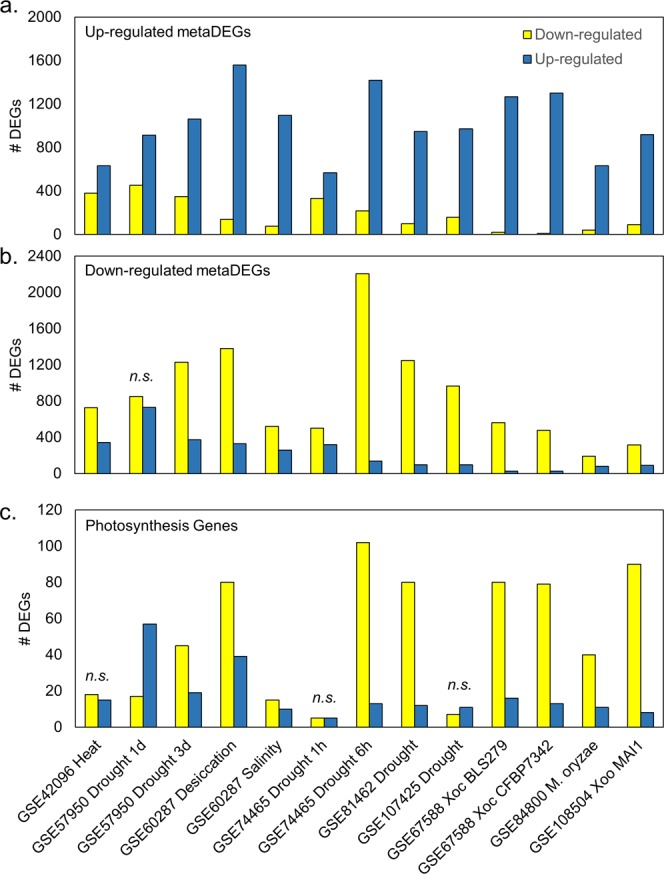
Environmental stresses greatly limit crop yield. With the increase in extreme weather events due to climate change and the constant pressure of diseases and pests, there is an urgent need to develop crop varieties that can tolerate multiple stresses. However, our knowledge of how plants broadly respond to stress is limited. Here, we explore the rice core stress response via meta-analysis of publicly available rice transcriptome data. Our results confirm that rice universally down-regulates photosynthesis in response to both abiotic and biotic stress. Rice also generally up-regulates hormone-responsive genes during stress response, most notably genes in the abscisic acid, jasmonic acid and salicylic acid pathways. We identified several promoter motifs that are likely involved in stress-responsive regulatory mechanisms in rice. With this work, we provide a list of candidate genes to study for improving rice stress tolerance in light of environmental stresses. This work also serves as a proof of concept to show that meta-analysis of diverse transcriptome data is a valid approach to develop robust hypotheses for how plants respond to stress.


Conflict of interest statement

The authors declare no competing interests.

Figures

Figure 1
Figure 1
Analyses reveal rice core stress responses to abiotic and biotic stresses. (a) Analysis pipeline used to conduct differential gene expression analysis and meta-analysis on publicly available data sets. Number of DEGs identified in all (b) abiotic and (c) biotic stress experiments. (d) MetaDEGs identified from meta-analyses. (e) Number of metaDEGs unique and common in abiotic and biotic meta-analyses up- (up arrow) and down-regulated (down arrow).
Figure 2
Figure 2
Rice hormone-responsive genes were generally up-regulated by stress. Observed number of up-regulated hormone-responsive metaDEGs is shown vs. the number expected to be up-regulated by random chance. Asterisks denote numbers observed differed significantly from numbers expected as determined by the χ2 goodness of fit test (***p < 10−14, **p < 10−6, *p < 0.005, see Table S5 for all p-values).
Figure 3
Figure 3
Signaling downstream of JA and SA is increased during stress. Gene expression (log2 fold changes) of JA- and SA-responsive metaDEGs for (a) abiotic stress and (b) biotic stresses relative to controls (columns) are shown on the right in yellow (down-regulated), black (not regulated) and cyan (up-regulated). Hormone regulatory patterns of JA- and SA-responsive metaDEGs are shown on the left in magenta (down-regulated), black (not regulated; n.r.) and white (up-regulated). Clusters of genes regulated oppositely of hormone pathways are indicated by the orange squares (C1 through C5).
Figure 4
Figure 4
De novo discovered promoter motifs. Sequence logos for motifs discovered via DREME, associated GO term annotations discovered via GOMo, and enrichment within metaDEG sets as determined by Fisher’s exact test (p ≤ 0.05).
Figure 5
Figure 5
Publicly available gene expression studies validated meta-analysis results. (a) Up- and (b) Down-regulated metaDEGs and (c) photosynthesis-annotated genes generally followed expected trends in pre-processed publicly available gene expression datasets. n.s. indicates the counts observed did not differ significantly from counts expected as determined by the χ2 goodness of fit test (p > 0.05, see Tables S7 and S8 for all p-values).

References

    1. Mafakheri A, Siosemardeh A, Bahramnejad B, Struik P, Sohrabi Y. Effect of drought stress on yield, proline and chlorophyll contents in three chickpea cultivars. Aust. J. Crop Sci. 2010;4:580.
    1. Lobell DB, Bänziger M, Magorokosho C, Vivek B. Nonlinear heat effects on African maize as evidenced by historical yield trials. Nat. Clim. Change. 2011;1:42. doi: 10.1038/nclimate1043. - DOI
    1. Semenov MA, Shewry PR. Modelling predicts that heat stress, not drought, will increase vulnerability of wheat in Europe. Sci. Rep. 2011;1:66. doi: 10.1038/srep00066. - DOI - PMC - PubMed
    1. Atkinson NJ, Urwin PE. The interaction of plant biotic and abiotic stresses: from genes to the field. J. Exp. Bot. 2012;63:3523–3543. doi: 10.1093/jxb/ers100. - DOI - PubMed
    1. Jongdee B, Pantuwan G, Fukai S, Fischer K. Improving drought tolerance in rainfed lowland rice: an example from Thailand. Agr. Water Manage. 2006;80:225–240. doi: 10.1016/j.agwat.2005.07.015. - DOI

Publication types