

Icariin Attenuates M1 Activation of Microglia and Aβ Plaque Accumulation in the Hippocampus and Prefrontal Cortex by Up-Regulating PPARγ in Restraint/Isolation-Stressed APP/PS1 Mice
- PMID: 31001073
- PMCID: PMC6455051
- DOI: 10.3389/fnins.2019.00291
Icariin Attenuates M1 Activation of Microglia and Aβ Plaque Accumulation in the Hippocampus and Prefrontal Cortex by Up-Regulating PPARγ in Restraint/Isolation-Stressed APP/PS1 Mice
Abstract
Background: Studies have shown that psychosocial stress is involved in Alzheimer's disease (AD) pathogenesis; it induces M1 microglia polarization and production of pro-inflammatory cytokines, leading to neurotoxic outcomes and decreased β-amyloid (Aβ) clearance. Icariin has been proven to be an effective anti-inflammatory agent and to activate peroxisome proliferator-activated receptors gamma (PPARγ) which induces the M2 phenotype in the microglia. However, whether restraint/isolation stress reduces the clearance ability of microglia by priming and polarizing microglia to the M1 phenotype, and the effects of icariin in attenuating the inflammatory response and relieving the pathological changes of AD are still unclear.
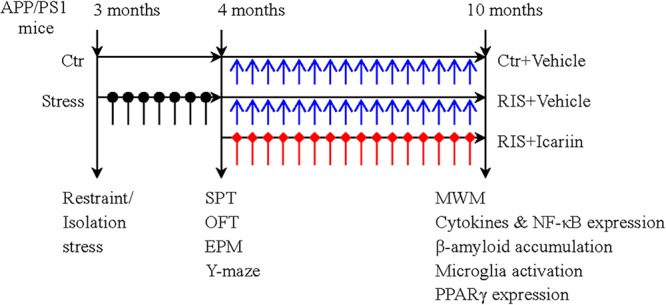
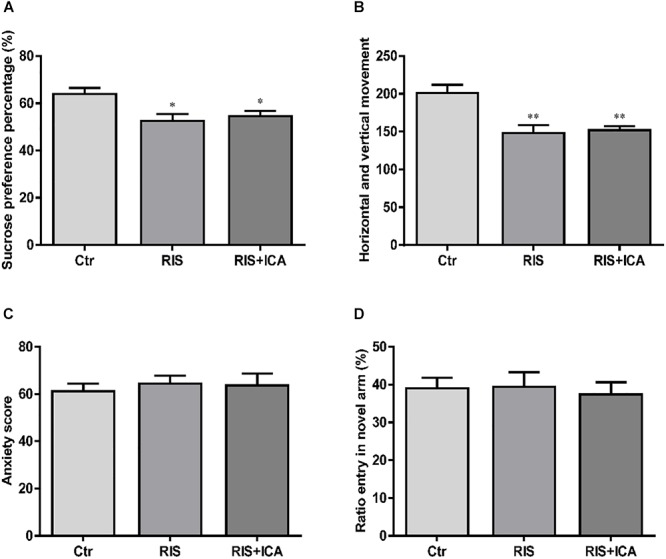
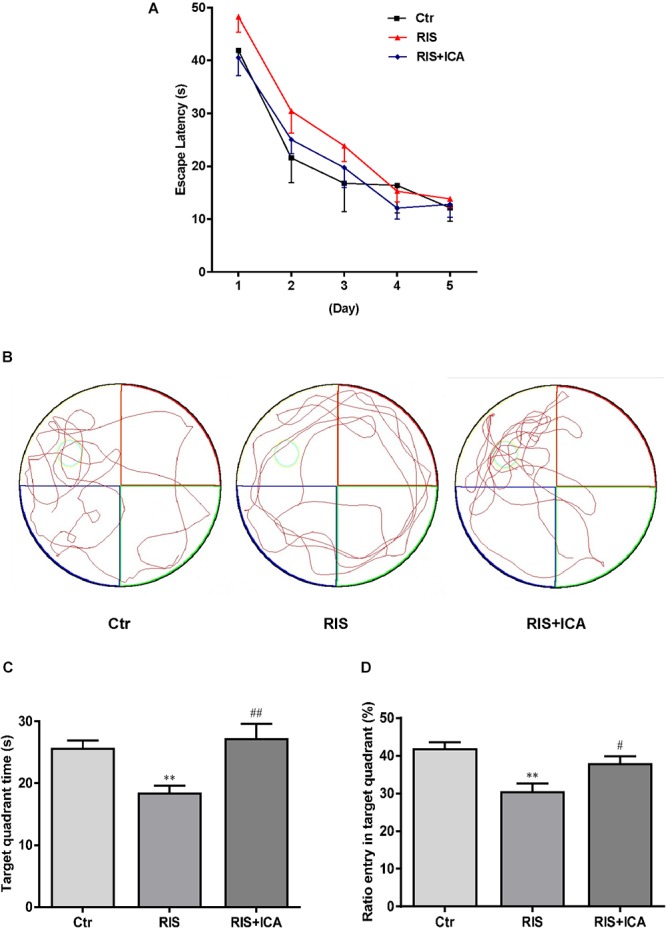
Methods: APP/PS1 mice (male, aged 3 months) were randomly divided into a control group, a restraint/isolation stress group, and a restraint/isolation stress + icariin group. The restraint/isolation stress group was subjected to a paradigm to build a depressive animal model. Sucrose preference, open field, elevated plus maze, and Y maze test were used to assess the stress paradigm. The Morris water maze test was performed to evaluate spatial reference learning and memory. Enzyme-linked immunosorbent assay and immunohistochemistry were used to identify the microglia phenotype and Aβ accumulation. Western blotting was used to detect the expression of PPARγ in the hippocampus and prefrontal cortex (PFC).
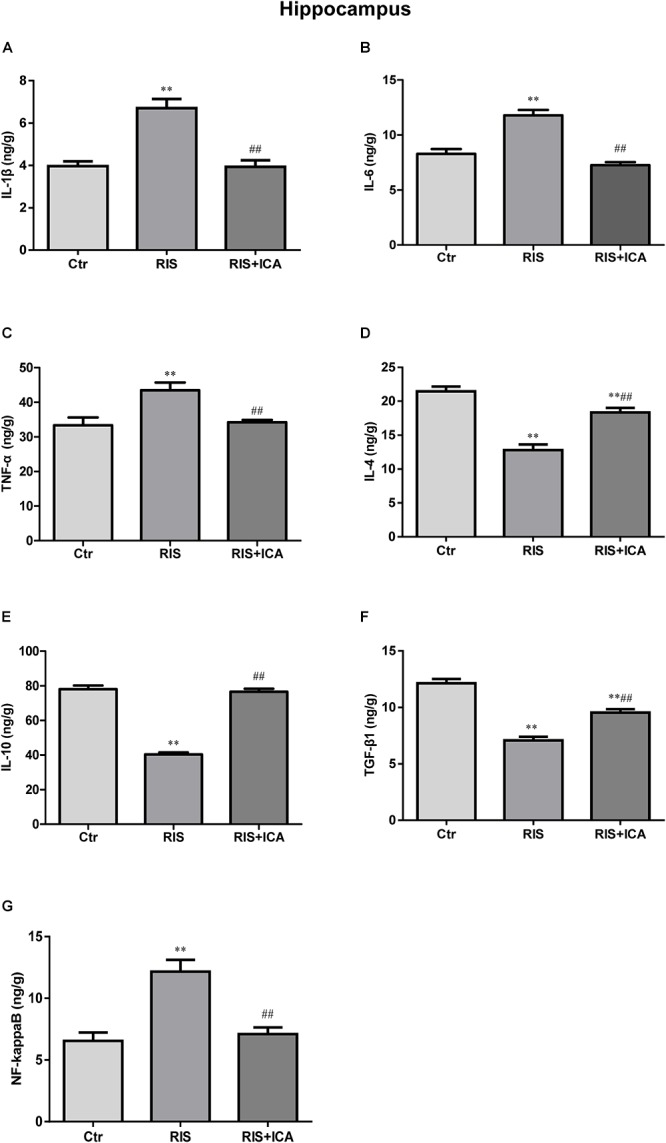
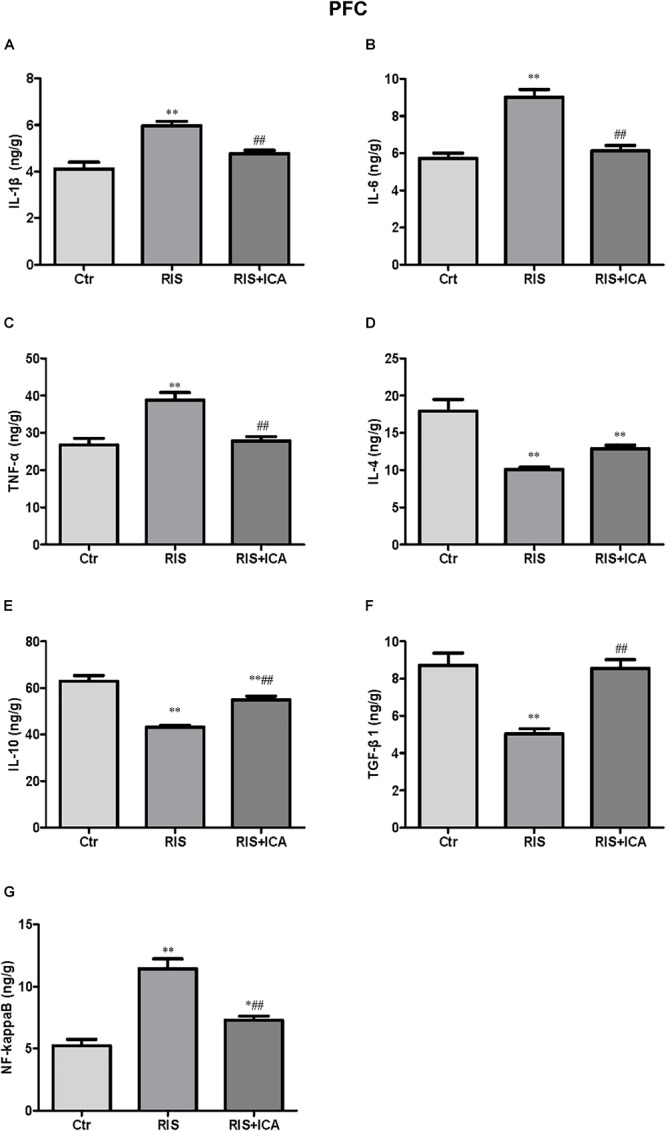
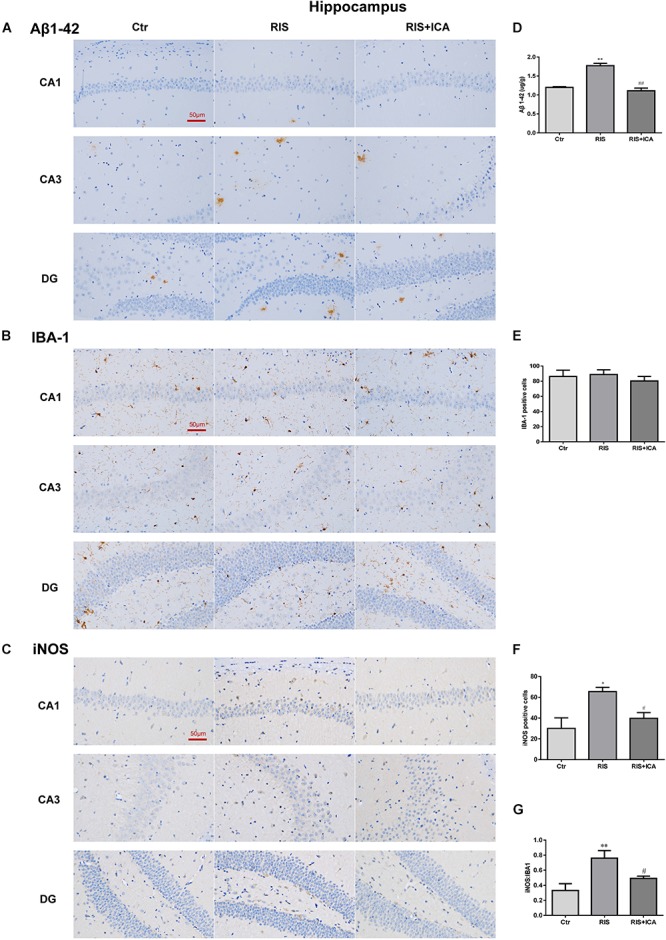
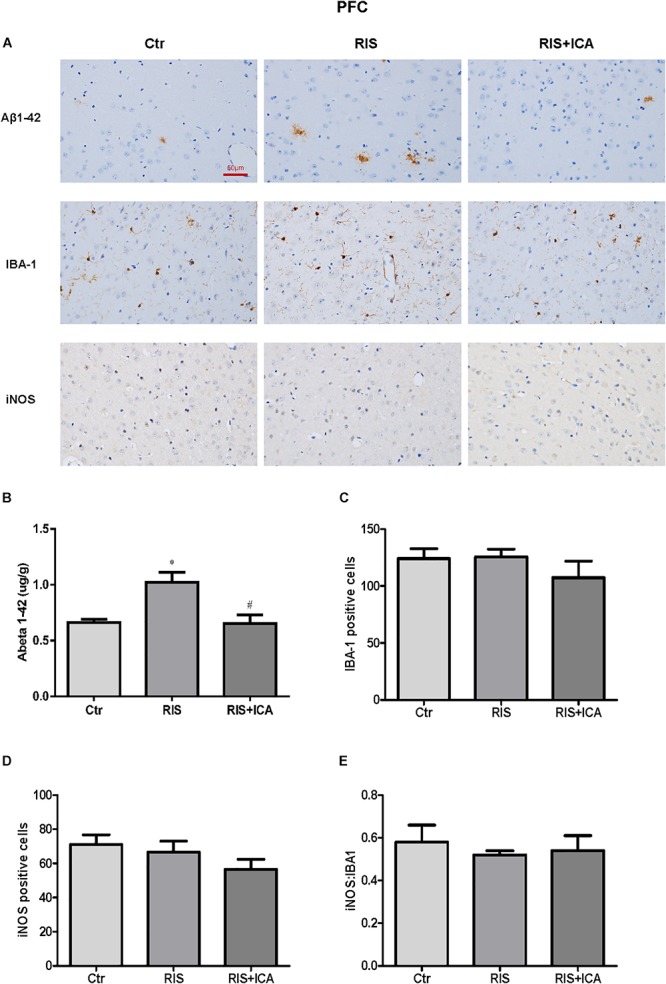
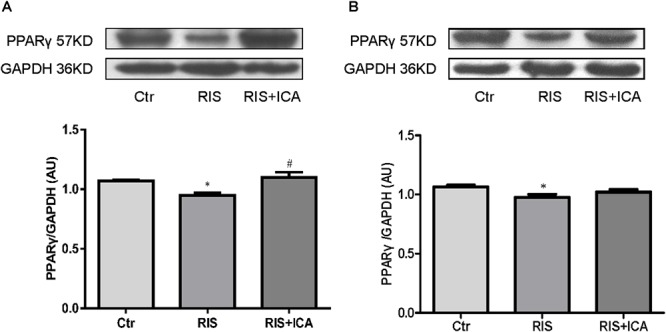
Results: Restraint/isolation stress induced significant depressive-like behaviors in APP/PS1 mice at 4 months of age and memory impairment at 10 months of age, while 6 months of icariin administration relieved the memory damage. Restraint/isolation stressed mice had elevated pro-inflammatory cytokines, decreased anti-inflammatory cytokines, increased Aβ plaque accumulation and more M1 phenotype microglia in the hippocampus and PFC at 10 months of age, while 6 months of icariin administration relieved these changes. Moreover, restraint/isolation stressed mice had down-regulated PPARγ expression in the hippocampus and PFC at 10 months of age, while 6 months of icariin administration reversed the alteration, especially in the hippocampus.
Conclusion: Restraint/isolation stress induced depressive-like behaviors and spatial memory damage, over-expression of M1 microglia markers and more severe Aβ accumulation by suppressing PPARγ in APP/PS1 mice. Icariin can be considered a new treatment option as it induces the switch of the microglia phenotype by activating PPARγ.
Keywords: Alzheimer’s disease; PPARγ; cytokine; hippocampus; icariin; microglia; prefrontal cortex; stress.
Figures
Similar articles
-
PPARγ-mediated microglial activation phenotype is involved in depressive-like behaviors and neuroinflammation in stressed C57BL/6J and ob/ob mice.Psychoneuroendocrinology. 2020 Jul;117:104674. doi: 10.1016/j.psyneuen.2020.104674. Epub 2020 May 1. Psychoneuroendocrinology. 2020. PMID: 32422516
-
Icariin decreases the expression of APP and BACE-1 and reduces the β-amyloid burden in an APP transgenic mouse model of Alzheimer's disease.Int J Biol Sci. 2014 Jan 21;10(2):181-91. doi: 10.7150/ijbs.6232. eCollection 2014. Int J Biol Sci. 2014. PMID: 24550686 Free PMC article.
-
The antidepressant-like effects of pioglitazone in a chronic mild stress mouse model are associated with PPARγ-mediated alteration of microglial activation phenotypes.J Neuroinflammation. 2016 Oct 4;13(1):259. doi: 10.1186/s12974-016-0728-y. J Neuroinflammation. 2016. PMID: 27716270 Free PMC article.
-
Dihydromyricetin inhibits microglial activation and neuroinflammation by suppressing NLRP3 inflammasome activation in APP/PS1 transgenic mice.CNS Neurosci Ther. 2018 Dec;24(12):1207-1218. doi: 10.1111/cns.12983. Epub 2018 Jun 4. CNS Neurosci Ther. 2018. PMID: 29869390 Free PMC article.
-
[Heixiaoyao Powder interferes with microglia polarization in AD model mice by regulating NOX2/ROS/NF-κB signaling pathway].Zhongguo Zhong Yao Za Zhi. 2023 Aug;48(15):4027-4038. doi: 10.19540/j.cnki.cjcmm.20230423.401. Zhongguo Zhong Yao Za Zhi. 2023. PMID: 37802770 Chinese.
Cited by
-
Role of dietary fatty acids in microglial polarization in Alzheimer's disease.J Neuroinflammation. 2020 Mar 24;17(1):93. doi: 10.1186/s12974-020-01742-3. J Neuroinflammation. 2020. PMID: 32209097 Free PMC article. Review.
-
A Path Toward Precision Medicine for Neuroinflammatory Mechanisms in Alzheimer's Disease.Front Immunol. 2020 Mar 31;11:456. doi: 10.3389/fimmu.2020.00456. eCollection 2020. Front Immunol. 2020. PMID: 32296418 Free PMC article. Review.
-
The Amyloid-β Pathway in Alzheimer's Disease.Mol Psychiatry. 2021 Oct;26(10):5481-5503. doi: 10.1038/s41380-021-01249-0. Epub 2021 Aug 30. Mol Psychiatry. 2021. PMID: 34456336 Free PMC article.
-
20(S)-protopanaxadiol and oleanolic acid ameliorate cognitive deficits in APP/PS1 transgenic mice by enhancing hippocampal neurogenesis.J Ginseng Res. 2021 Mar;45(2):325-333. doi: 10.1016/j.jgr.2020.07.003. Epub 2020 Jul 16. J Ginseng Res. 2021. PMID: 33841013 Free PMC article.
-
Novel Pharmacological Approaches to the Treatment of Depression.Life (Basel). 2022 Jan 28;12(2):196. doi: 10.3390/life12020196. Life (Basel). 2022. PMID: 35207483 Free PMC article. Review.
References
-
- Carroll J. C., Iba M., Bangasser D. A., Valentino R. J., James M. J., Brunden K. R., et al. (2011). Chronic stress exacerbates tau pathology, neurodegeneration, and cognitive performance through a corticotropin-releasing factor receptor-dependent mechanism in a transgenic mouse model of tauopathy. J. Neurosci. 31 14436–14449. 10.1523/JNEUROSCI.3836-11.2011 - DOI - PMC - PubMed
LinkOut - more resources
Full Text Sources
Miscellaneous