

Acute Social Defeat Stress Increases Sleep in Mice
- PMID: 31001080
- PMCID: PMC6456680
- DOI: 10.3389/fnins.2019.00322
Acute Social Defeat Stress Increases Sleep in Mice
Abstract
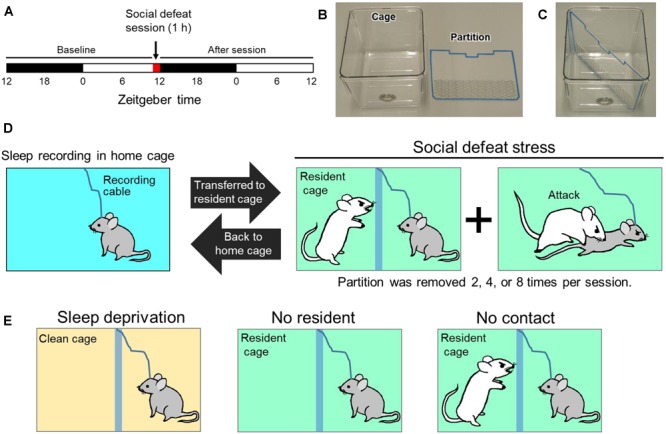
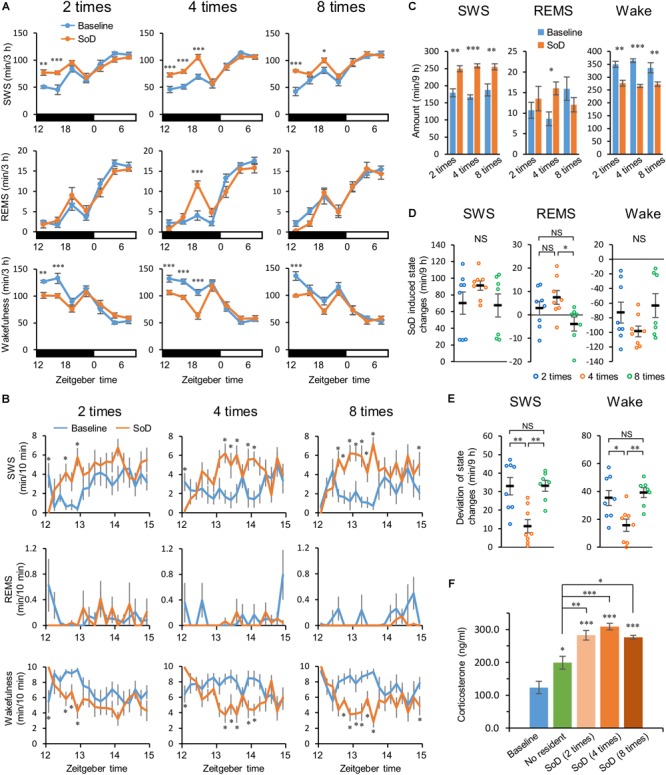
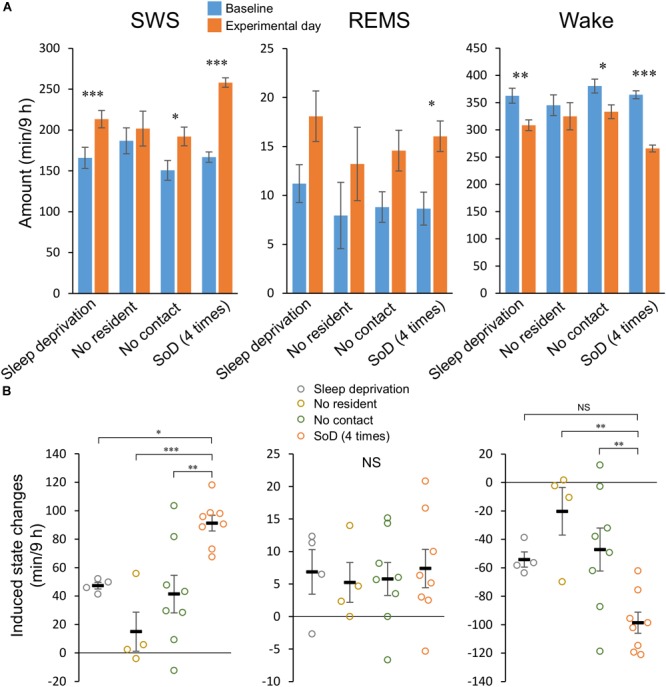
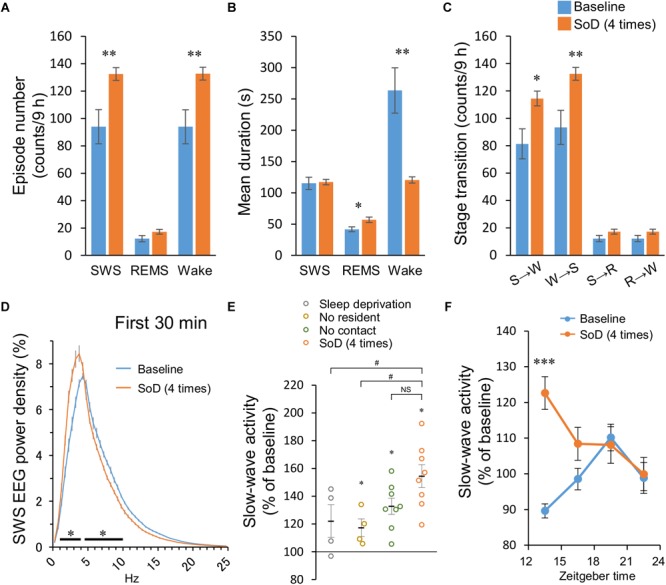
Social conflict is a major source of stress in humans. Animals also experience social conflicts and cope with them by stress responses that facilitate arousal and activate sympathetic and neuroendocrine systems. The effect of acute social defeat (SoD) stress on the sleep/wake behavior of mice has been reported in several models based on a resident-intruder paradigm. However, the post-SoD stress sleep/wake effects vary between the studies and the contribution of specific effects in response to SoD or non-specific effects of the SoD procedure (e.g., sleep deprivation) is not well established. In this study, we established a mouse model of acute SoD stress based on strong aggressive mouse behavior toward unfamiliar intruders. In our model, we prevented severe attacks of resident mice on submissive intruder mice to minimize behavioral variations during SoD. In response to SoD, slow-wave sleep (SWS) strongly increased during 9 h. Although some sleep changes after SoD stress can be attributed to non-specific effects of the SoD procedure, most of the SWS increase is likely a specific response to SoD. Slow-wave activity was only enhanced for a short period after SoD and dissipated long before the SWS returned to baseline. Moreover, SoD evoked a strong corticosterone response that may indicate a high stress level in the intruder mice after SoD. Our SoD model may be useful for studying the mechanisms and functions of sleep in response to social stress.
Keywords: homeostatic sleep need; mouse model; slow-wave activity; slow-wave sleep; social defeat stress.
Figures
Similar articles
-
A double exposure to social defeat induces sub-chronic effects on sleep and open field behaviour in rats.Physiol Behav. 2008 Nov 28;95(4):553-61. doi: 10.1016/j.physbeh.2008.07.031. Epub 2008 Aug 14. Physiol Behav. 2008. PMID: 18762205
-
Effects of social defeat on sleep and behaviour: importance of the confrontational behaviour.Physiol Behav. 2014 Mar 29;127:54-63. doi: 10.1016/j.physbeh.2014.01.010. Epub 2014 Jan 25. Physiol Behav. 2014. PMID: 24472325
-
Deep sleep after social stress: NREM sleep slow-wave activity is enhanced in both winners and losers of a conflict.Brain Behav Immun. 2015 Jul;47:149-54. doi: 10.1016/j.bbi.2014.12.022. Epub 2015 Jan 10. Brain Behav Immun. 2015. PMID: 25585138
-
Defeat stress in rodents: From behavior to molecules.Neurosci Biobehav Rev. 2015 Dec;59:111-40. doi: 10.1016/j.neubiorev.2015.10.006. Epub 2015 Oct 22. Neurosci Biobehav Rev. 2015. PMID: 26475995 Review.
-
Social Defeat Stress, Sex, and Addiction-Like Behaviors.Int Rev Neurobiol. 2018;140:271-313. doi: 10.1016/bs.irn.2018.07.009. Epub 2018 Jul 30. Int Rev Neurobiol. 2018. PMID: 30193707 Review.
Cited by
-
Nucleus Accumbens Medium Spiny Neuron Subtypes Differentially Regulate Stress-Associated Alterations in Sleep Architecture.Biol Psychiatry. 2021 Jun 15;89(12):1138-1149. doi: 10.1016/j.biopsych.2020.12.030. Epub 2021 Jan 13. Biol Psychiatry. 2021. PMID: 33715826 Free PMC article.
-
Mechanisms of Sleep/Wake Regulation under Hypodopaminergic State: Insights from MitoPark Mouse Model of Parkinson's Disease.Adv Sci (Weinh). 2023 Feb;10(5):e2203170. doi: 10.1002/advs.202203170. Epub 2022 Dec 14. Adv Sci (Weinh). 2023. PMID: 36515271 Free PMC article.
-
Sleep in Drosophila and Its Context.Front Physiol. 2019 Sep 11;10:1167. doi: 10.3389/fphys.2019.01167. eCollection 2019. Front Physiol. 2019. PMID: 31572216 Free PMC article. Review.
-
Abnormal Sleep Signals Vulnerability to Chronic Social Defeat Stress.Front Neurosci. 2021 Jan 12;14:610655. doi: 10.3389/fnins.2020.610655. eCollection 2020. Front Neurosci. 2021. PMID: 33510614 Free PMC article.
-
Insomnia-related rodent models in drug discovery.Acta Pharmacol Sin. 2024 Sep;45(9):1777-1792. doi: 10.1038/s41401-024-01269-w. Epub 2024 Apr 26. Acta Pharmacol Sin. 2024. PMID: 38671193 Free PMC article. Review.
References
LinkOut - more resources
Full Text Sources