

Adjustment of Synchronization Stability of Dynamic Brain-Networks Based on Feature Fusion
- PMID: 31001095
- PMCID: PMC6455007
- DOI: 10.3389/fnhum.2019.00098
Adjustment of Synchronization Stability of Dynamic Brain-Networks Based on Feature Fusion
Abstract
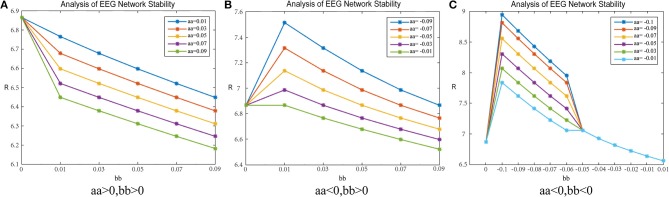
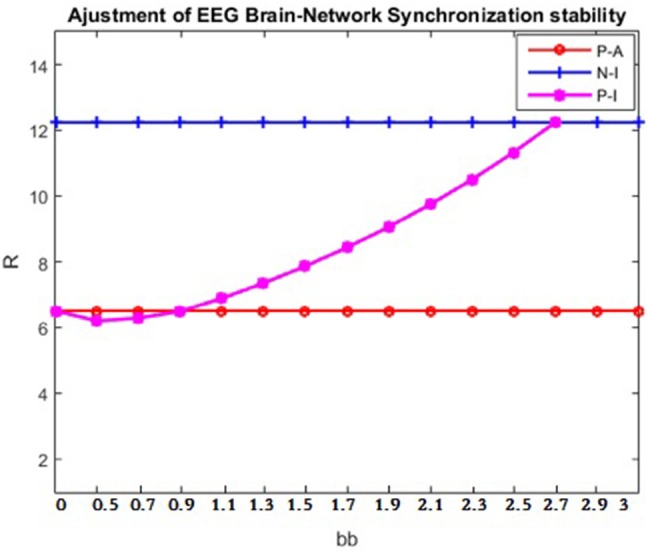
When the brain is active, the neural activities of different regions are integrated on various spatial and temporal scales; this is termed the synchronization phenomenon in neurobiological theory. This synchronicity is also the main underlying mechanism for information integration and processing in the brain. Clinical medicine has found that some of the neurological diseases that are difficult to cure have deficiencies or abnormalities in the whole or local integration processes of the brain. By studying the synchronization capabilities of the brain-network, we can intensively describe and characterize both the state of the interactions between brain regions and their differences between people with a mental illness and a set of controls by measuring the rapid changes in brain activity in patients with psychiatric disorders and the strength and integrity of their entire brain network. This is significant for the study of mental illness. Because static brain network connection methods are unable to assess the dynamic interactions within the brain, we introduced the concepts of dynamics and variability in a constructed EEG brain functional network based on dynamic connections, and used it to analyze the variability in the time characteristics of the EEG functional network. We used the spectral features of the brain network to extract its synchronization features and used the synchronization features to describe the process of change and the differences in the brain network's synchronization ability between a group of patients and healthy controls during a working memory task. We propose a method based on the fusion of traditional features and spectral features to achieve an adjustment of the patient's brain network synchronization ability, so that its synchronization ability becomes consistent with that of healthy controls, theoretically achieving the purpose of the treatment of the diseases. Studying the stability of brain network synchronization can provide new insights into the pathogenic mechanism and cure of mental diseases and has a wide range of potential applications.
Keywords: EEG; EEG dynamic brain network; brain network synchronization adjustment and control; brain network synchronization stability; working memory.
Figures
Similar articles
-
Brain network features based on theta-gamma cross-frequency coupling connections in EEG for emotion recognition.Neurosci Lett. 2021 Sep 14;761:136106. doi: 10.1016/j.neulet.2021.136106. Epub 2021 Jul 9. Neurosci Lett. 2021. PMID: 34252515
-
Synchronization Stability Model of Complex Brain Networks: An EEG Study.Front Psychiatry. 2020 Dec 4;11:571068. doi: 10.3389/fpsyt.2020.571068. eCollection 2020. Front Psychiatry. 2020. PMID: 33343416 Free PMC article.
-
Long-range EEG phase synchronization during an arithmetic task indexes a coherent cortical network simultaneously measured by fMRI.Neuroimage. 2005 Sep;27(3):553-63. doi: 10.1016/j.neuroimage.2005.04.030. Neuroimage. 2005. PMID: 15921932 Clinical Trial.
-
Mapping of the neuronal networks of human cortical brain functions.Adv Tech Stand Neurosurg. 2003;28:91-142. doi: 10.1007/978-3-7091-0641-9_2. Adv Tech Stand Neurosurg. 2003. PMID: 12627809 Review.
-
The application of graph theoretical analysis to complex networks in the brain.Clin Neurophysiol. 2007 Nov;118(11):2317-31. doi: 10.1016/j.clinph.2007.08.010. Epub 2007 Sep 27. Clin Neurophysiol. 2007. PMID: 17900977 Review.
Cited by
-
Effects of Motor Imagery Tasks on Brain Functional Networks Based on EEG Mu/Beta Rhythm.Brain Sci. 2022 Jan 30;12(2):194. doi: 10.3390/brainsci12020194. Brain Sci. 2022. PMID: 35203957 Free PMC article.
-
[Research progress and application of transfer entropy algorithm].Sheng Wu Yi Xue Gong Cheng Xue Za Zhi. 2022 Jun 25;39(3):612-619. doi: 10.7507/1001-5515.202109067. Sheng Wu Yi Xue Gong Cheng Xue Za Zhi. 2022. PMID: 35788531 Free PMC article. Chinese.
-
Alterations in white matter network dynamics in patients with schizophrenia and bipolar disorder.Hum Brain Mapp. 2022 Sep;43(13):3909-3922. doi: 10.1002/hbm.25892. Epub 2022 May 13. Hum Brain Mapp. 2022. PMID: 35567336 Free PMC article.
-
Emotional arousal in 2D versus 3D virtual reality environments.PLoS One. 2021 Sep 9;16(9):e0256211. doi: 10.1371/journal.pone.0256211. eCollection 2021. PLoS One. 2021. PMID: 34499667 Free PMC article.
References
-
- Babloyantz A., Salazar J. M., Nicolis C. (1986). Evidence of chaotic dynamics of brain activity during the sleep cycle. Phys. Lett. A. 111, 152–156. 10.1016/0375-9601(85)90444-X - DOI
LinkOut - more resources
Full Text Sources