

Abnormal Phase Coupling in Parkinson's Disease and Normalization Effects of Subthreshold Vestibular Stimulation
- PMID: 31001099
- PMCID: PMC6456700
- DOI: 10.3389/fnhum.2019.00118
Abnormal Phase Coupling in Parkinson's Disease and Normalization Effects of Subthreshold Vestibular Stimulation
Abstract
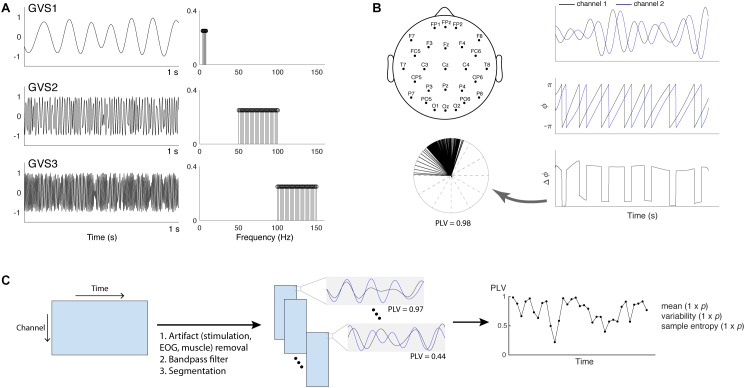
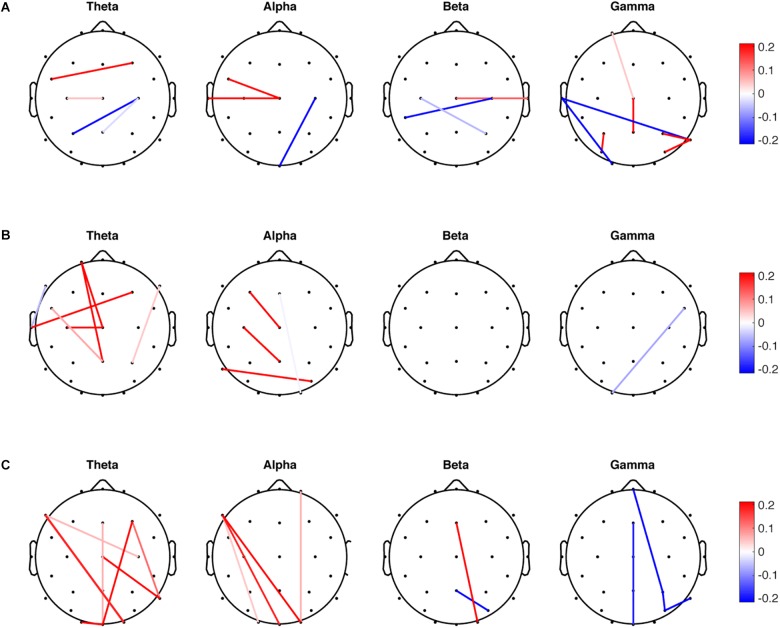
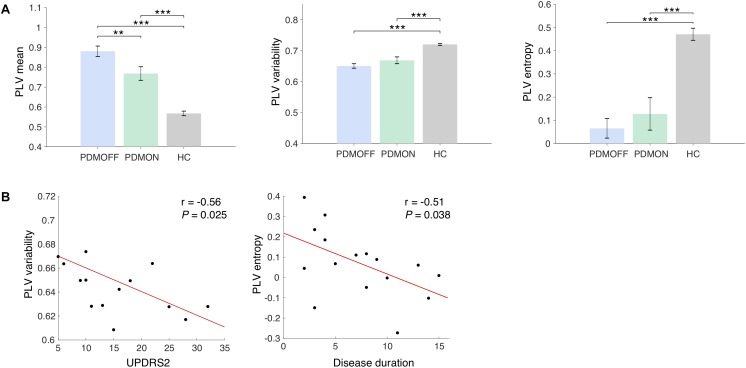
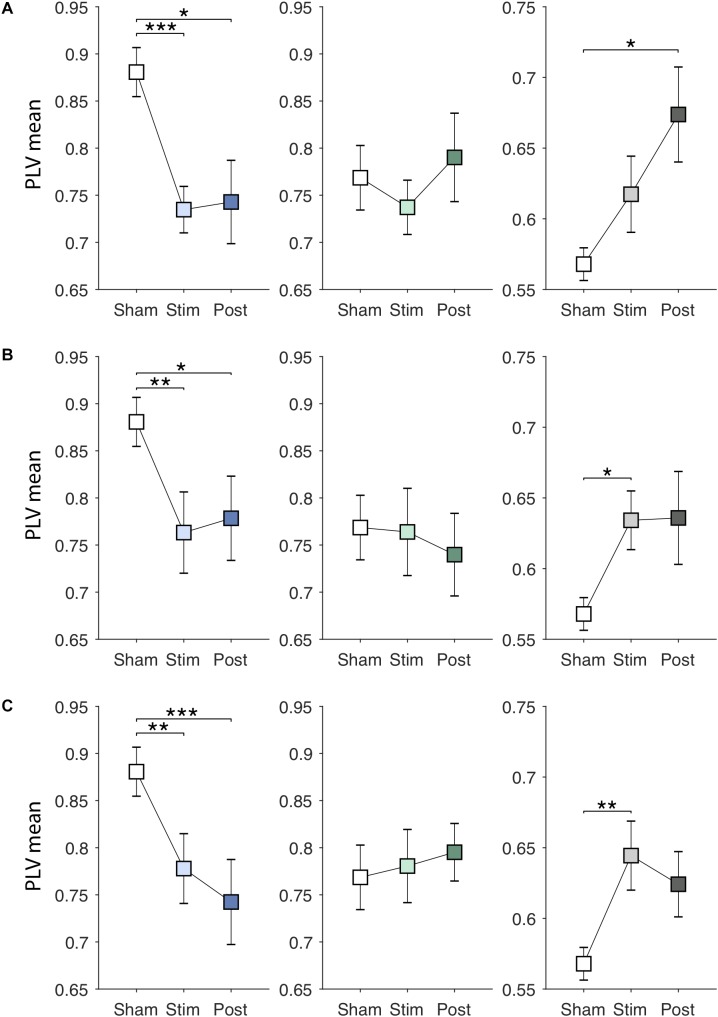
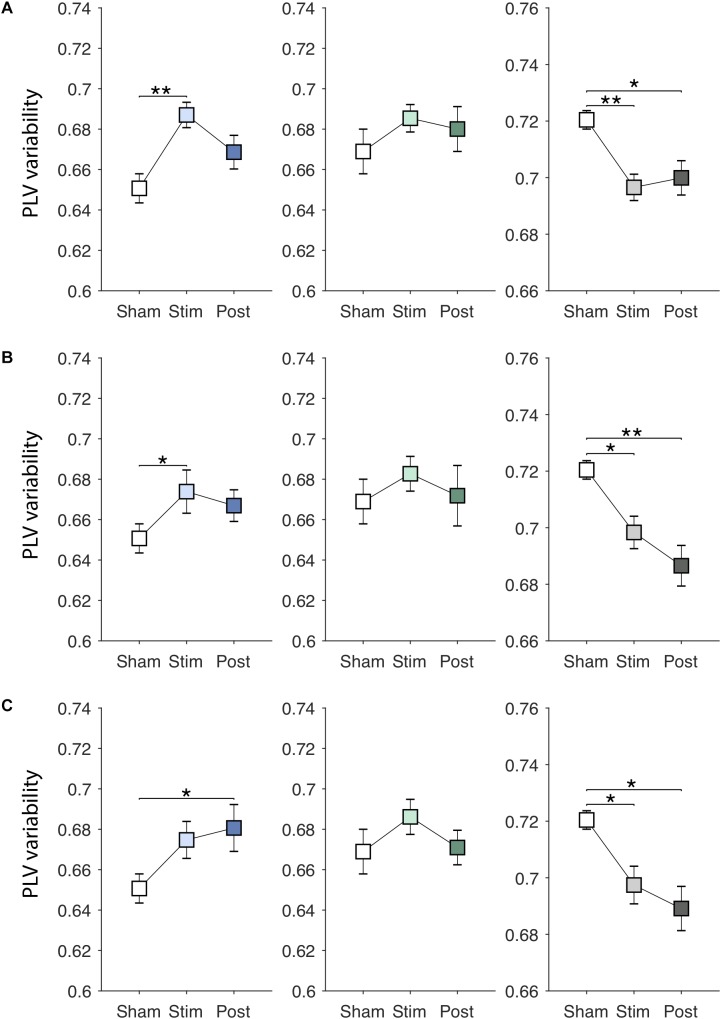
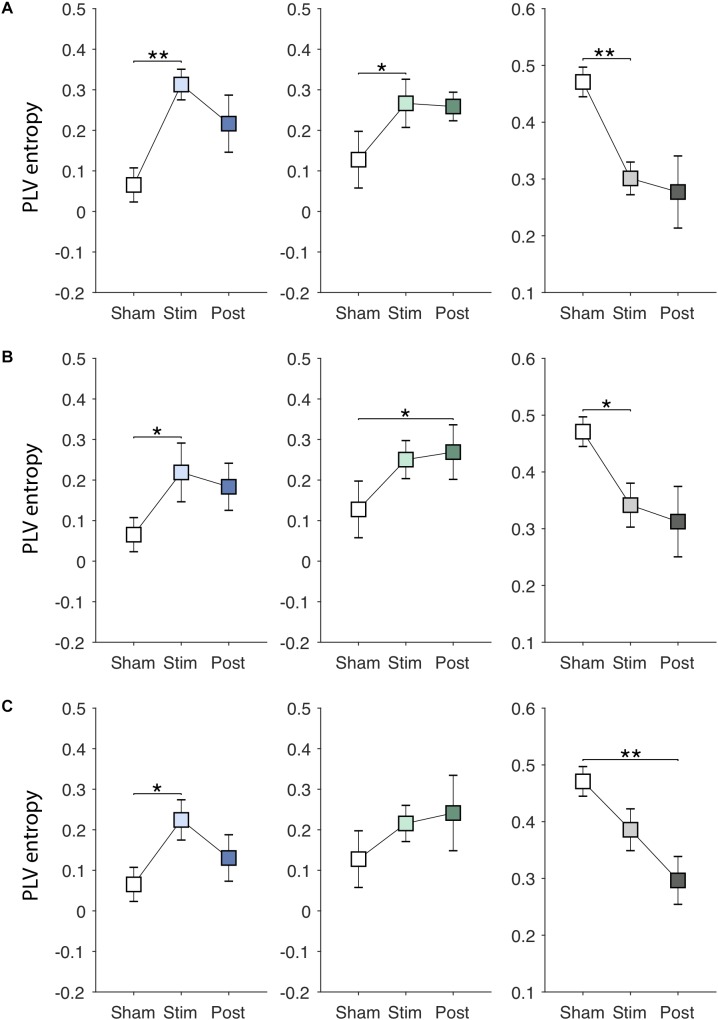
The human brain is a highly dynamic structure requiring dynamic coordination between different neural systems to perform numerous cognitive and behavioral tasks. Emerging perspectives on basal ganglia (BG) and thalamic functions have highlighted their role in facilitating and mediating information transmission among cortical regions. Thus, changes in BG and thalamic structures can induce aberrant modulation of cortico-cortical interactions. Recent work in deep brain stimulation (DBS) has demonstrated that externally applied electrical current to BG structures can have multiple downstream effects in large-scale brain networks. In this work, we identified EEG-based altered resting-state cortical functional connectivity in Parkinson's disease (PD) and examined effects of dopaminergic medication and electrical vestibular stimulation (EVS), a non-invasive brain stimulation (NIBS) technique capable of stimulating the BG and thalamus through vestibular pathways. Resting EEG was collected from 16 PD subjects and 18 age-matched, healthy controls (HC) in four conditions: sham (no stimulation), EVS1 (4-8 Hz multisine), EVS2 (50-100 Hz multisine) and EVS3 (100-150 Hz multisine). The mean, variability, and entropy were extracted from time-varying phase locking value (PLV), a non-linear measure of pairwise functional connectivity, to probe abnormal cortical couplings in the PD subjects. We found the mean PLV of Cz and C3 electrodes were important for discrimination between PD and HC subjects. In addition, the PD subjects exhibited lower variability and entropy of PLV (mostly in theta and alpha bands) compared to the controls, which were correlated with their clinical characteristics. While levodopa medication was effective in normalizing the mean PLV only, all EVS stimuli normalized the mean, variability and entropy of PLV in the PD subject, with the exact extent and duration of improvement a function of stimulus type. These findings provide evidence demonstrating both low- and high-frequency EVS exert widespread influences on cortico-cortical connectivity, likely via subcortical activation. The improvement observed in PD in a stimulus-dependent manner suggests that EVS with optimized parameters may provide a new non-invasive means for neuromodulation of functional brain networks.
Keywords: EEG; Parkinson’s disease; cortical oscillations; electrical vestibular stimulation; phase locking value; sample entropy; sparse discriminant analysis.
Figures
Similar articles
-
Quantitative High Density EEG Brain Connectivity Evaluation in Parkinson's Disease: The Phase Locking Value (PLV).J Clin Med. 2023 Feb 11;12(4):1450. doi: 10.3390/jcm12041450. J Clin Med. 2023. PMID: 36835985 Free PMC article.
-
Large-scale frontoparietal theta, alpha, and beta phase synchronization: A set of EEG differential characteristics for freezing of gait in Parkinson's disease?Front Aging Neurosci. 2022 Oct 26;14:988037. doi: 10.3389/fnagi.2022.988037. eCollection 2022. Front Aging Neurosci. 2022. PMID: 36389071 Free PMC article.
-
Frequency-Specific Effects of Galvanic Vestibular Stimulation on Response-Time Performance in Parkinson's Disease.Front Neurol. 2021 Nov 2;12:758122. doi: 10.3389/fneur.2021.758122. eCollection 2021. Front Neurol. 2021. PMID: 34795633 Free PMC article.
-
Impairment of brain functions in Parkinson's disease reflected by alterations in neural connectivity in EEG studies: A viewpoint.Clin Neurophysiol. 2019 Feb;130(2):239-247. doi: 10.1016/j.clinph.2018.11.013. Epub 2018 Dec 3. Clin Neurophysiol. 2019. PMID: 30580247 Review.
-
Abnormal neural oscillations during gait and dual-task in Parkinson's disease.Front Syst Neurosci. 2022 Sep 15;16:995375. doi: 10.3389/fnsys.2022.995375. eCollection 2022. Front Syst Neurosci. 2022. PMID: 36185822 Free PMC article. Review.
Cited by
-
Preservation of Eye Movements in Parkinson's Disease Is Stimulus- and Task-Specific.J Neurosci. 2022 Jan 19;42(3):487-499. doi: 10.1523/JNEUROSCI.1690-21.2021. Epub 2021 Nov 30. J Neurosci. 2022. PMID: 34848498 Free PMC article.
-
Quantitative High Density EEG Brain Connectivity Evaluation in Parkinson's Disease: The Phase Locking Value (PLV).J Clin Med. 2023 Feb 11;12(4):1450. doi: 10.3390/jcm12041450. J Clin Med. 2023. PMID: 36835985 Free PMC article.
-
An Individualized Multi-Modal Approach for Detection of Medication "Off" Episodes in Parkinson's Disease via Wearable Sensors.J Pers Med. 2023 Jan 31;13(2):265. doi: 10.3390/jpm13020265. J Pers Med. 2023. PMID: 36836501 Free PMC article.
-
Magnetic Fields and Magnetically Stimulated Gold-Coated Superparamagnetic Iron Oxide Nanoparticles Differentially Modulate L-Type Voltage-Gated Calcium Channel Activity in Midbrain Neurons.ACS Appl Nano Mater. 2022 Jan 28;5(1):205-215. doi: 10.1021/acsanm.1c02665. Epub 2022 Jan 5. ACS Appl Nano Mater. 2022. PMID: 40342618 Free PMC article.
-
Parkinson's disease detection based on multi-pattern analysis and multi-scale convolutional neural networks.Front Neurosci. 2022 Jul 27;16:957181. doi: 10.3389/fnins.2022.957181. eCollection 2022. Front Neurosci. 2022. PMID: 35968382 Free PMC article.
References
LinkOut - more resources
Full Text Sources
Miscellaneous