Age, but Not Amyloidosis, Induced Changes in Global Levels of Histone Modifications in Susceptible and Disease-Resistant Neurons in Alzheimer's Disease Model Mice
- PMID: 31001106
- PMCID: PMC6456813
- DOI: 10.3389/fnagi.2019.00068
Age, but Not Amyloidosis, Induced Changes in Global Levels of Histone Modifications in Susceptible and Disease-Resistant Neurons in Alzheimer's Disease Model Mice
Abstract
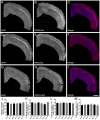
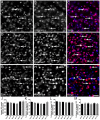
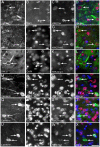
There is increasing interest in the role of epigenetic alterations in Alzheimer's disease (AD). The epigenome of every cell type is distinct, yet data regarding epigenetic change in specific cell types in aging and AD is limited. We investigated histone tail modifications in neuronal subtypes in wild-type and APP/PS1 mice at 3 (pre-pathology), 6 (pathology-onset) and 12 (pathology-rich) months of age. In neurofilament (NF)-positive pyramidal neurons (vulnerable to AD pathology), and in calretinin-labeled interneurons (resistant to AD pathology) there were no global alterations in histone 3 lysine 4 trimethylation (H3K4me3), histone 3 lysine 27 acetylation (H3K27ac) or histone 3 lysine 27 trimethylation (H3K27me3) in APP/PS1 compared to wild-type mice at any age. Interestingly, age-related changes in the presence of H3K27ac and H3K27me3 were detected in NF-labeled pyramidal neurons and calretinin-positive interneurons, respectively. These data suggest that the global levels of histone modifications change with age, whilst amyloid plaque deposition and its sequelae do not result in global alterations of H3K4me3, H3K27ac and H3K27me3 in NF-positive pyramidal neurons or calretinin-labeled interneurons.
Keywords: H3K27me3; H3K4me3; H4K27ac; calretinin; epigenetics; neurofilament triplet proteins.
Figures


Similar articles
-
Neurofilament-labeled pyramidal neurons and astrocytes are deficient in DNA methylation marks in Alzheimer's disease.Neurobiol Aging. 2016 Sep;45:30-42. doi: 10.1016/j.neurobiolaging.2016.05.003. Epub 2016 May 10. Neurobiol Aging. 2016. PMID: 27459923
-
Neurites containing the neurofilament-triplet proteins are selectively vulnerable to cytoskeletal pathology in Alzheimer's disease and transgenic mouse models.Front Neuroanat. 2013 Sep 26;7:30. doi: 10.3389/fnana.2013.00030. eCollection 2013. Front Neuroanat. 2013. PMID: 24133416 Free PMC article.
-
Histone H3 Lysine 4 and 27 Trimethylation Landscape of Human Alzheimer's Disease.Cells. 2022 Feb 19;11(4):734. doi: 10.3390/cells11040734. Cells. 2022. PMID: 35203383 Free PMC article.
-
Modeling Alzheimer's disease in transgenic mice: effect of age and of presenilin1 on amyloid biochemistry and pathology in APP/London mice.Exp Gerontol. 2000 Sep;35(6-7):831-41. doi: 10.1016/s0531-5565(00)00149-2. Exp Gerontol. 2000. PMID: 11053674 Review.
-
Histone Modifications in Major Depressive Disorder and Related Rodent Models.Adv Exp Med Biol. 2017;978:169-183. doi: 10.1007/978-3-319-53889-1_9. Adv Exp Med Biol. 2017. PMID: 28523546 Review.
Cited by
-
Role of primary aging hallmarks in Alzheimer´s disease.Theranostics. 2023 Jan 1;13(1):197-230. doi: 10.7150/thno.79535. eCollection 2023. Theranostics. 2023. PMID: 36593969 Free PMC article. Review.
-
Epigenetics: Recent Advances and Its Role in the Treatment of Alzheimer's Disease.Front Neurol. 2020 Oct 15;11:538301. doi: 10.3389/fneur.2020.538301. eCollection 2020. Front Neurol. 2020. PMID: 33178099 Free PMC article. Review.
-
The impact of sex on memory during aging and Alzheimer's disease progression: Epigenetic mechanisms.J Alzheimers Dis. 2024 Dec;102(3):562-576. doi: 10.1177/13872877241288709. Epub 2024 Nov 14. J Alzheimers Dis. 2024. PMID: 39539121 Free PMC article. Review.
-
Impaired ATF3 signaling involves SNAP25 in SOD1 mutant ALS patients.Sci Rep. 2023 Jul 25;13(1):12019. doi: 10.1038/s41598-023-38684-8. Sci Rep. 2023. PMID: 37491426 Free PMC article.
-
Histone Methylation Regulation in Neurodegenerative Disorders.Int J Mol Sci. 2021 Apr 28;22(9):4654. doi: 10.3390/ijms22094654. Int J Mol Sci. 2021. PMID: 33925016 Free PMC article. Review.
References
LinkOut - more resources
Full Text Sources

