. 2019 Apr 2:11:74.
doi: 10.3389/fnagi.2019.00074. eCollection 2019.

Identifying Changepoints in Biomarkers During the Preclinical Phase of Alzheimer's Disease

Affiliations

Identifying Changepoints in Biomarkers During the Preclinical Phase of Alzheimer's Disease

Laurent Younes et al. Front Aging Neurosci. .

Abstract

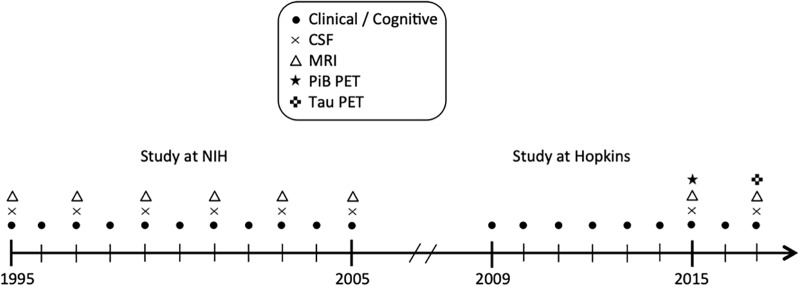
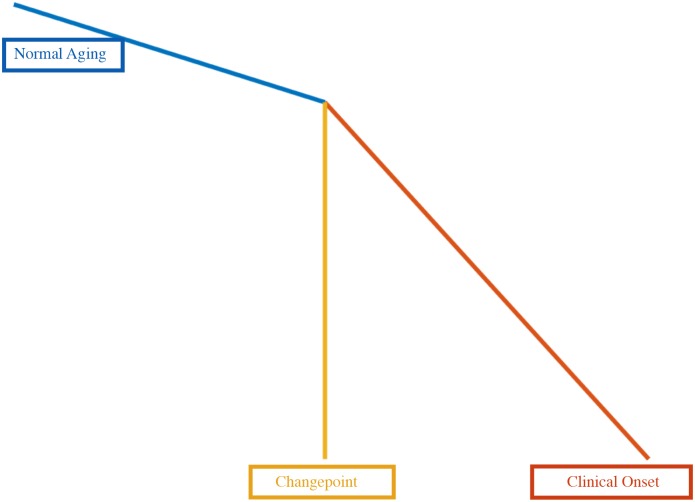
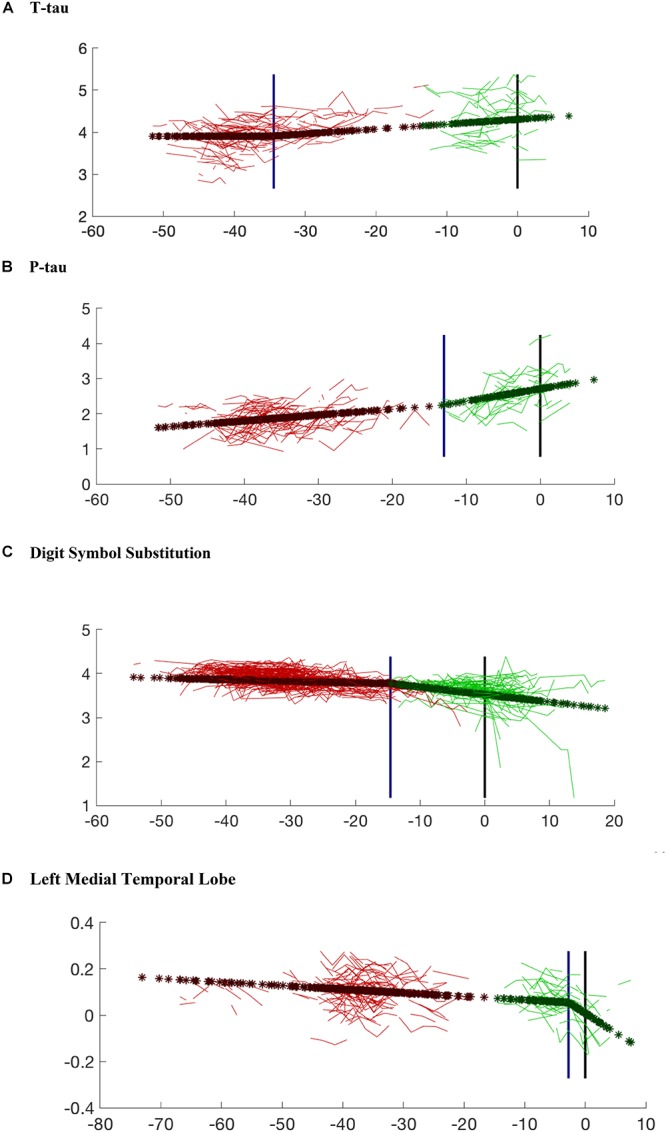
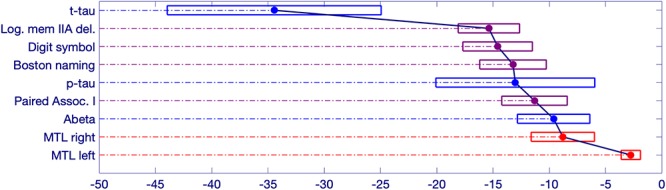
Objective: Several models have been proposed for the evolution of Alzheimer's disease (AD) biomarkers. The aim of this study was to identify changepoints in a range of biomarkers during the preclinical phase of AD. Methods: We examined nine measures based on cerebrospinal fluid (CSF), magnetic resonance imaging (MRI) and cognitive testing, obtained from 306 cognitively normal individuals, a subset of whom subsequently progressed to the symptomatic phase of AD. A changepoint model was used to determine which of the measures had a significant change in slope in relation to clinical symptom onset. Results: All nine measures had significant changepoints, all of which preceded symptom onset, however, the timing of these changepoints varied considerably. A single measure, CSF t-tau, had an early changepoint (34 years prior to symptom onset). A group of measures, including the remaining CSF measures (CSF Abeta and phosphorylated tau) and all cognitive tests had changepoints 10-15 years prior to symptom onset. A second group is formed by medial temporal lobe shape composite measures, with a 6-year time difference between the right and left side (respectively nine and 3 years prior to symptom onset). Conclusion: These findings highlight the long period of time prior to symptom onset during which AD pathology is accumulating in the brain. There are several significant findings, including the early changes in cognition and the laterality of the MRI findings. Additional work is needed to clarify their significance.

Keywords: CSF assessment; biomarkers; changepoints; cognitive assessment; preclinical Alzheimer’s disease; shape analysis.


Figures

Figure 1
Figure 1
Schematic representation of the study design.
Figure 2
Figure 2
Schematic representation of the changepoint model.
Figure 3
Figure 3
Model prediction for each variable compared with the observed data. The variables shown in the figures include: (A) CSF t-tau; (B) CSF p-tau; (C) Digit Symbol Substitution Test; (D) Left Medial Temporal Lobe Volume. The red lines are the observed data for the subjects who remained cognitively normal. The green lines represent individuals who progressed to cognitive impairment. Dark red stars (and dark green stars, respectively) are the model predictions for the same subjects for whom observed data are presented. The blue vertical line marks the estimated changepoint. The black vertical line marks the estimated onset of clinical symptoms. The age of onset for the subjects who remained cognitively normal was imputed via Bayesian prediction. Note that the x-axis values for cognitively normal subjects are based on an estimated clinical onset time (since the “true one” is right-censored), using the posterior mean of its distribution given the observed data. This explains the gap that can be observed in some graphs between actual and censored observations, since the latter lacks the statistical variability around the estimated posterior mean.
Figure 4
Figure 4
Schematic representation of significant changepoint results in relation to symptom onset. The estimated onset of clinical symptoms is represented by the value of 0 at the bottom right side of the figure. The numbers to the left of the 0 represent the estimated number of years prior to symptom onset for the changepoint of each variable. The width of each box represents a bias-corrected 75% confidence interval for the estimated value of each variable.
Figure 5
Figure 5
A precedence graph representing the order of the changepoints among the variables with significant changepoints. An arrow between groups of variables indicates that, more than 75% of the time, the changepoint for the variable represented as the ‘source’ was found to be earlier than the changepoint for the variable represented as the ‘target,’ using bootstrap samples. The groupings of the variables were computed using hierarchical clustering within each modality, based on the precedence probability vectors. Arrows that can be inferred by transitivity are not shown for clarity.

Similar articles

Cited by

References

    1. Albert M., Soldan A., Gottesman R., McKhann G., Sacktor N., Farrington L., et al. (2014). Cognitive changes preceding clinical symptom onset of mild cognitive impairment and relationship to ApoE genotype. Curr. Alzheimer Res. 11 773–784. 10.2174/156720501108140910121920 - DOI - PMC - PubMed
    1. Beg M. F., Miller M. I., Trouv’e A., Younes L. (2005). Computing metrics via geodesics on flows of diffeomorphisms. Int. J. Comp. Vis. 61 139–157. 10.1023/B:VISI.0000043755.93987.aa - DOI
    1. Chang L., Shan D., Wickman J., Holdridge M., Raso C., Wilson D., et al. (2017). “SimoA human neurology 3-plex A (N3PA) immunoassay measures amyloid beta 1-42, amyloid beta 1-40 and tau in blood and CSF samples simultaneously,” in Poster Presented at the Alzheimer’s Association International Conference, Lexington.
    1. Csernansky J. C., Joshi S., Wang L., Gado M., Miller J. P., Grenander U., et al. (1998). Hippocampal morphometry in schizophrenia by high dimensional brain mapping. Proc. Nat. Acad. Sci. U.S.A. 95 11406–11411. 10.1073/pnas.95.19.11406 - DOI - PMC - PubMed
    1. Csernansky J. G., Wang L., Joshi S., Miller J. P., Gado M., Kido D., et al. (2000). Early DAT is distinguished from aging by high-dimensional mapping of the hippocampus. Neurology 55 1636–1643. 10.1212/WNL.55.11.1636 - DOI - PubMed

LinkOut - more resources