

Alteronol Enhances the Anti-tumor Activity and Reduces the Toxicity of High-Dose Adriamycin in Breast Cancer
- PMID: 31001113
- PMCID: PMC6455060
- DOI: 10.3389/fphar.2019.00285
Alteronol Enhances the Anti-tumor Activity and Reduces the Toxicity of High-Dose Adriamycin in Breast Cancer
Abstract
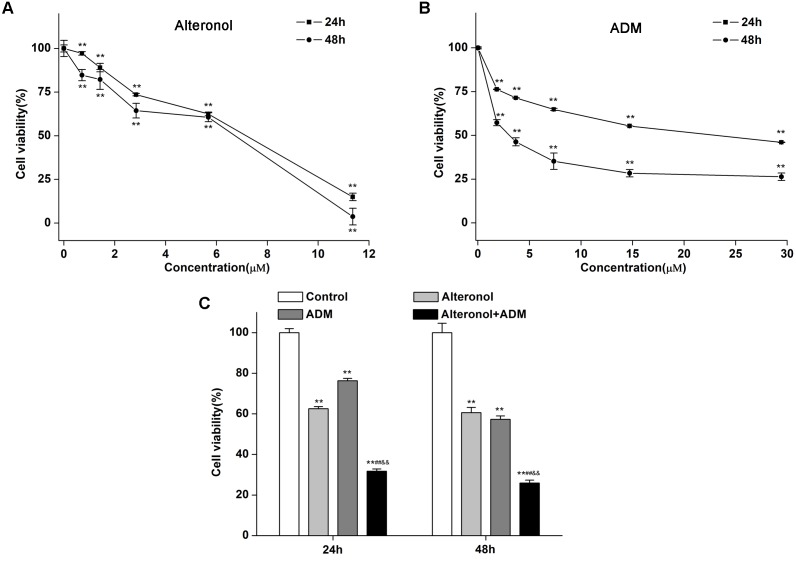
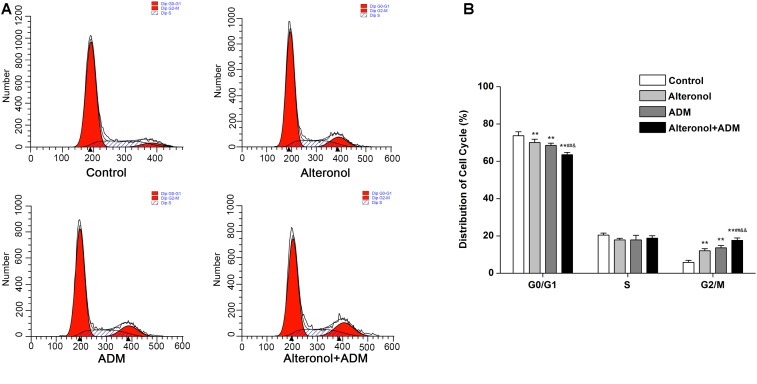
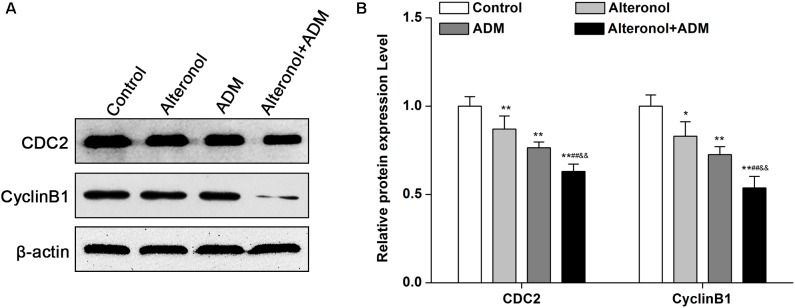
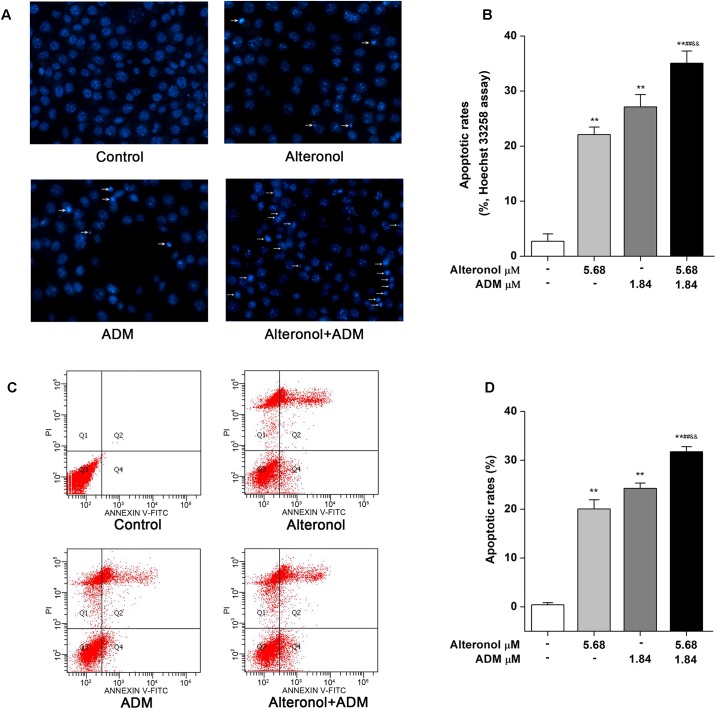
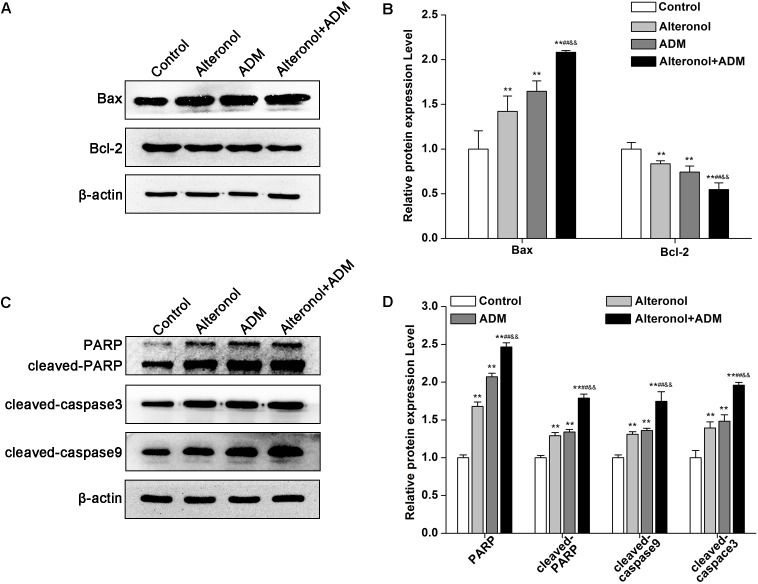
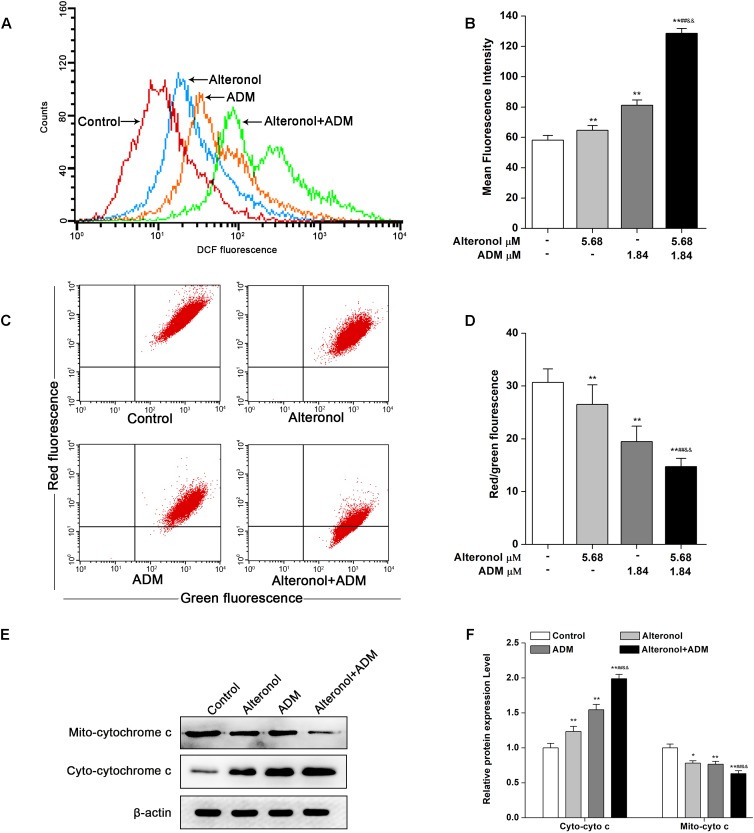
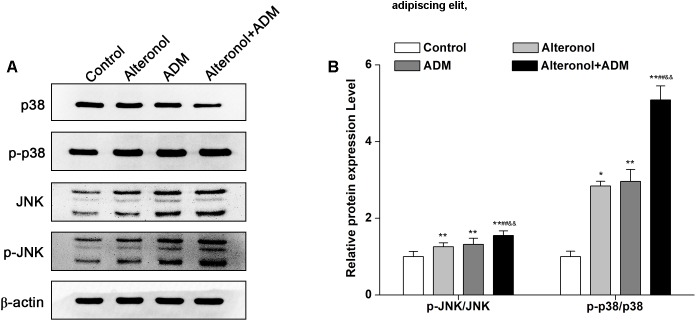
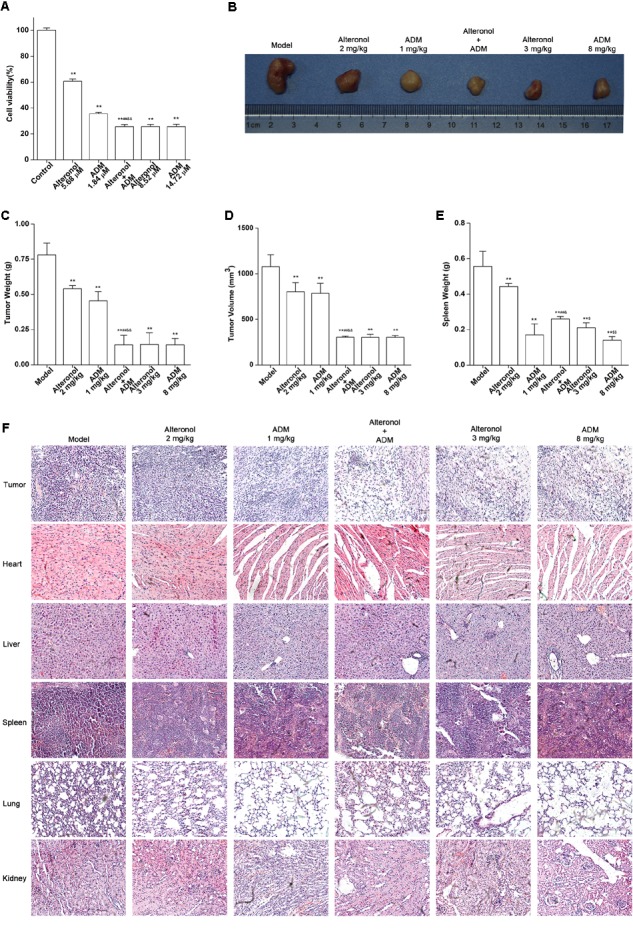
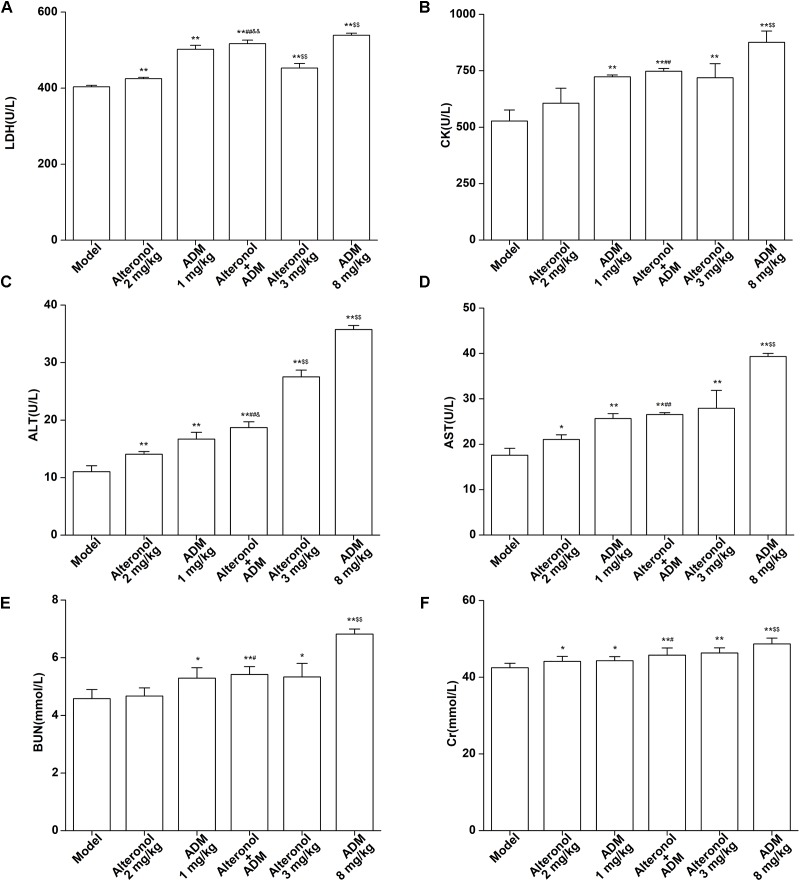
The first-line chemotherapy drug adriamycin (ADM) is widely used for the treatment of breast cancer, but the acquired drug resistance and the normal tissue toxicity remain clinical challenges. Alteronol has been reported to exert wide-ranging anti-tumor activity. In this study, we firstly examined the synergistic anti-tumor effects and the underlying mechanisms of alteronol combined with ADM in breast cancer. We have found that the combination of alteronol and ADM significantly suppressed the expression levels of the cell cycle-related proteins (CDC2 and Cyclin B1) and induced cell cycle arrest at the G2/M phase, leading to cell proliferation inhibition in breast cancer 4T1 cells. Moreover, co-treatment of alteronol and ADM (i) remarkably activated p38 and JNK kinases, (ii) elevated ROS levels, (iii) triggered mitochondrial dysfunction, (iv) released cytochrome c into the cytoplasm, (v) upregulated apoptosis-related proteins, e.g., cleaved PARP, Bax, and cleaved caspase-3/9, and (vi) downregulated the expression of Bcl-2, followed by apoptosis. Furthermore, our in vivo studies showed that the low-dose combination of alteronol (2 mg/kg) and ADM (1 mg/kg) significantly inhibited tumor growth in tumor bearing mice, and the anti-tumor effect of the combination was the same as that of high-dose ADM (8 mg/kg). In addition, the low-dose combination group showed lower toxicities to major organs than the high-dose ADM group. Taken together, these data demonstrate that the low-dose combination of alteronol and ADM could notably improve the anti-tumor activity and have lower toxicities to major organs than those in high-dose ADM group.
Keywords: adriamycin; alteronol; apoptosis; breast cancer; cell cycle arrest; chemotherapy.
Figures
Similar articles
-
Alteronol induces cell cycle arrest and apoptosis via increased reactive oxygen species production in human breast cancer T47D cells.J Pharm Pharmacol. 2018 Apr;70(4):516-524. doi: 10.1111/jphp.12879. Epub 2018 Feb 7. J Pharm Pharmacol. 2018. PMID: 29411391
-
4-Hydroxybenzoic acid (4-HBA) enhances the sensitivity of human breast cancer cells to adriamycin as a specific HDAC6 inhibitor by promoting HIPK2/p53 pathway.Biochem Biophys Res Commun. 2018 Oct 12;504(4):812-819. doi: 10.1016/j.bbrc.2018.08.043. Epub 2018 Sep 11. Biochem Biophys Res Commun. 2018. PMID: 30217455
-
The synergistic effect of 2,3,5,4'-Tetrahydroxystilbene-2-O-β-d-glucoside combined with Adriamycin on MCF-7 breast cancer cells.Drug Des Devel Ther. 2018 Nov 30;12:4083-4094. doi: 10.2147/DDDT.S186028. eCollection 2018. Drug Des Devel Ther. 2018. PMID: 30555223 Free PMC article.
-
Alternol/Alteronol: Potent Anti-cancer Compounds With Multiple Mechanistic Actions.Front Oncol. 2020 Nov 3;10:568110. doi: 10.3389/fonc.2020.568110. eCollection 2020. Front Oncol. 2020. PMID: 33224877 Free PMC article. Review.
-
Albanol B from Mulberries Exerts Anti-Cancer Effect through Mitochondria ROS Production in Lung Cancer Cells and Suppresses In Vivo Tumor Growth.Int J Mol Sci. 2020 Dec 14;21(24):9502. doi: 10.3390/ijms21249502. Int J Mol Sci. 2020. PMID: 33327489 Free PMC article. Review.
Cited by
-
Luteolin potentiates low-dose oxaliplatin-induced inhibitory effects on cell proliferation in gastric cancer by inducing G2/M cell cycle arrest and apoptosis.Oncol Lett. 2022 Jan;23(1):16. doi: 10.3892/ol.2021.13134. Epub 2021 Nov 12. Oncol Lett. 2022. PMID: 34820015 Free PMC article.
-
Natural compound Alternol exerts a broad anti-cancer spectrum and a superior therapeutic safety index in vivo.Front Pharmacol. 2024 May 24;15:1409506. doi: 10.3389/fphar.2024.1409506. eCollection 2024. Front Pharmacol. 2024. PMID: 38855749 Free PMC article.
-
Hydroxyl safflower yellow B combined with doxorubicin inhibits the proliferation of human breast cancer MCF-7 cells.Oncol Lett. 2021 May;21(5):426. doi: 10.3892/ol.2021.12687. Epub 2021 Mar 29. Oncol Lett. 2021. PMID: 33850567 Free PMC article.
-
Neochamaejasmin A Induces Mitochondrial-Mediated Apoptosis in Human Hepatoma Cells via ROS-Dependent Activation of the ERK1/2/JNK Signaling Pathway.Oxid Med Cell Longev. 2020 Jan 20;2020:3237150. doi: 10.1155/2020/3237150. eCollection 2020. Oxid Med Cell Longev. 2020. PMID: 32411325 Free PMC article.
-
Construction of a programmed activation nanosystem based on intracellular hypoxia in cisplatin-resistant tumor cells for reversing cisplatin resistance.Mater Today Bio. 2025 Mar 26;32:101709. doi: 10.1016/j.mtbio.2025.101709. eCollection 2025 Jun. Mater Today Bio. 2025. PMID: 40230650 Free PMC article.
References
-
- Ardavanis A., Kountourakis P., Kyriakou F., Malliou S., Mantzaris I., Garoufali A., et al. (2008). Trastuzumab plus paclitaxel or docetaxel in HER-2-negative/HER-2 ECD-positive anthracycline- and taxane-refractory advanced breast cancer. Oncologist 13 361–369. 10.1634/theoncologist.2007-0207 - DOI - PubMed
-
- Chu K. H., Xing H. (2008). Method of inducing apoptosis in cancer treatment by using cucurbitacins. U.S. Patent No 20080207578A1.
LinkOut - more resources
Full Text Sources
Research Materials
Miscellaneous