

Characterization of the Asymmetry of the Cardiac and Sympathetic Arms of the Baroreflex From Spontaneous Variability During Incremental Head-Up Tilt
- PMID: 31001137
- PMCID: PMC6454064
- DOI: 10.3389/fphys.2019.00342
Characterization of the Asymmetry of the Cardiac and Sympathetic Arms of the Baroreflex From Spontaneous Variability During Incremental Head-Up Tilt
Abstract
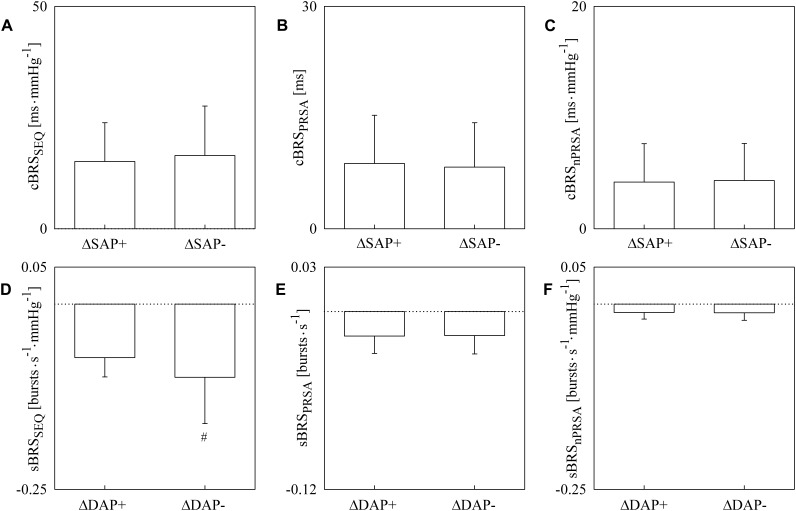
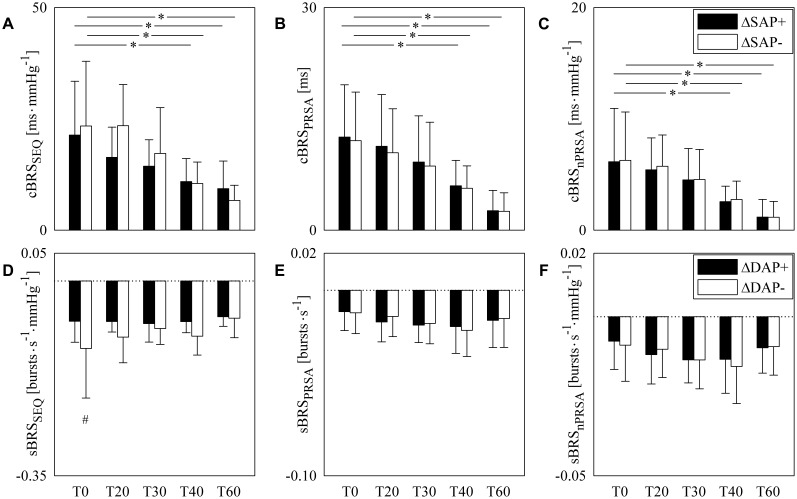
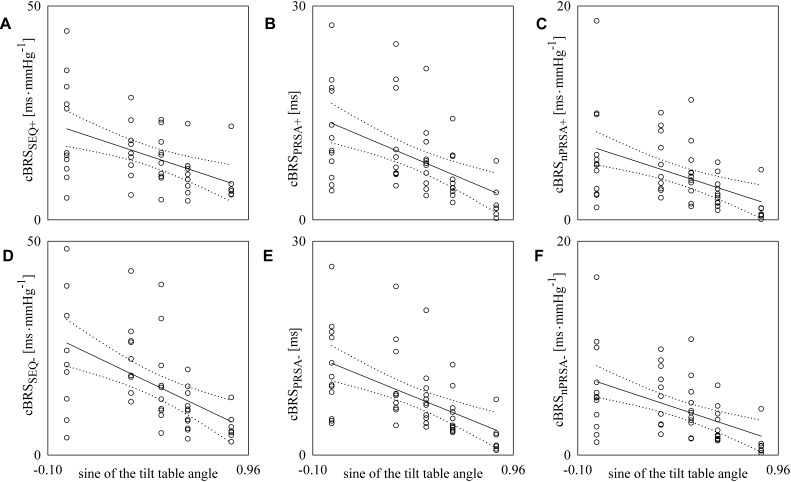
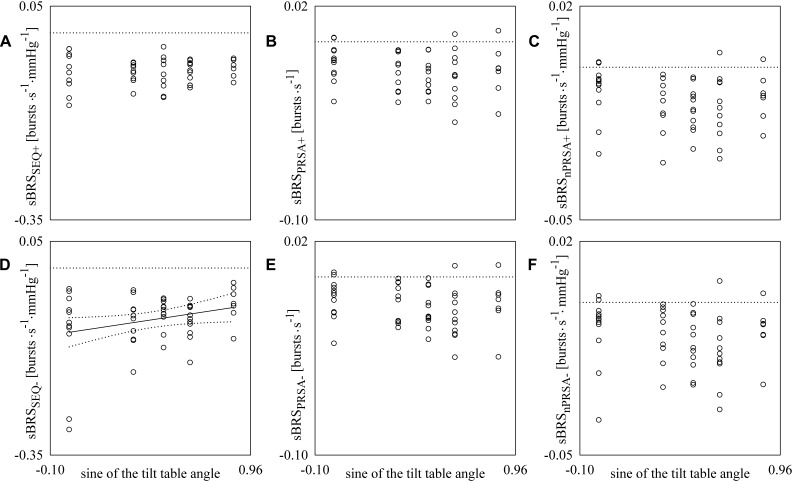
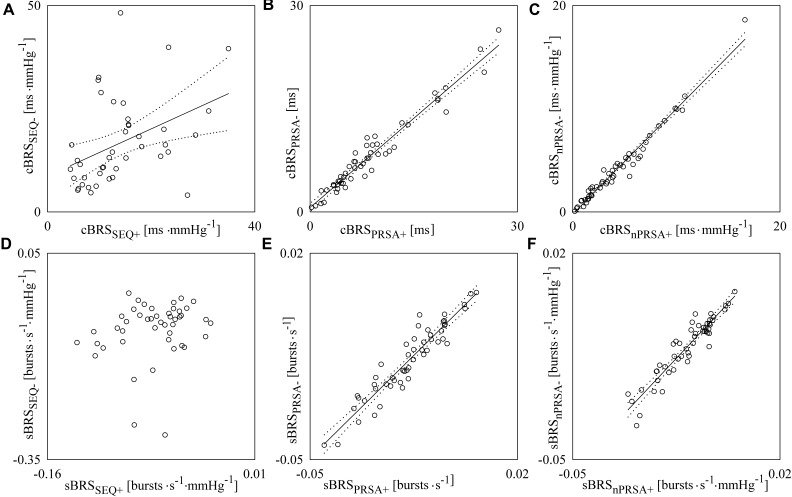
Hysteresis of the baroreflex (BR) is the result of the different BR sensitivity (BRS) when arterial pressure (AP) rises or falls. This phenomenon has been poorly studied and almost exclusively examined by applying pharmacological challenges and static approaches disregarding causal relations. This study inspects the asymmetry of the cardiac BR (cBR) and vascular sympathetic BR (sBR) in physiological closed loop conditions from spontaneous fluctuations of physiological variables, namely heart period (HP) and systolic AP (SAP) leading to the estimation of cardiac BRS (cBRS) and muscle sympathetic nerve activity (MSNA) and diastolic AP (DAP) leading to the estimation of vascular sympathetic BRS (sBRS). The assessment was carried out in 12 young healthy subjects undergoing incremental head-up tilt with table inclination gradually increased from 0 to 60°. Two analytical methods were exploited and compared, namely the sequence (SEQ) and phase-rectified signal averaging (PRSA) methods. SEQ analysis is based on the detection of joint causal schemes representing the HP and MSNA burst rate delayed responses to spontaneous SAP and DAP modifications, respectively. PRSA analysis averages HP and MSNA burst rate patterns after aligning them according to the direction of SAP and DAP changes, respectively. Since cBRSs were similar when SAP went up or down, hysteresis of cBR was not detected. Conversely, hysteresis of sBR was evident with sBRS more negative when DAP was falling than rising. sBR hysteresis was no longer visible during sympathetic activation induced by the orthostatic challenge. These results were obtained via the SEQ method, while the PRSA technique appeared to be less powerful in describing the BR asymmetry due to the strong association between BRS estimates computed over positive and negative AP variations. This study suggests that cBR and sBR provide different information about the BR control, sBR exhibits more relevant non-linear features that are evident even during physiological changes of AP, and the SEQ method can be fruitfully exploited to characterize the BR hysteresis with promising applications to BR branches different from cBR and sBR.
Keywords: MSNA; autonomic nervous system; baroreflex sequence analysis; cardiovascular control; heart rate variability; hysteresis; muscle sympathetic nerve activity; phase-rectified signal averaging.
Figures
Similar articles
-
Simultaneous Characterization of Sympathetic and Cardiac Arms of the Baroreflex through Sequence Techniques during Incremental Head-Up Tilt.Front Physiol. 2016 Sep 29;7:438. doi: 10.3389/fphys.2016.00438. eCollection 2016. Front Physiol. 2016. PMID: 27746741 Free PMC article.
-
Separating arterial pressure increases and decreases in assessing cardiac baroreflex sensitivity via sequence and bivariate phase-rectified signal averaging techniques.Med Biol Eng Comput. 2018 Jul;56(7):1241-1252. doi: 10.1007/s11517-017-1765-0. Epub 2017 Dec 13. Med Biol Eng Comput. 2018. PMID: 29235056
-
Assessing the strength of cardiac and sympathetic baroreflex controls via transfer entropy during orthostatic challenge.Philos Trans A Math Phys Eng Sci. 2017 Jun 28;375(2096):20160290. doi: 10.1098/rsta.2016.0290. Philos Trans A Math Phys Eng Sci. 2017. PMID: 28507235
-
Evaluation of the correlation between cardiac and sympathetic baroreflex sensitivity before orthostatic syncope.Annu Int Conf IEEE Eng Med Biol Soc. 2015;2015:2063-6. doi: 10.1109/EMBC.2015.7318793. Annu Int Conf IEEE Eng Med Biol Soc. 2015. PMID: 26736693
-
Peripheral Resistance Baroreflex During Incremental Bicycle Ergometer Exercise: Characterization and Correlation With Cardiac Baroreflex.Front Physiol. 2018 Jun 5;9:688. doi: 10.3389/fphys.2018.00688. eCollection 2018. Front Physiol. 2018. PMID: 29922179 Free PMC article.
Cited by
-
Directional sensitivity of dynamic cerebral autoregulation during spontaneous fluctuations in arterial blood pressure at rest.J Cereb Blood Flow Metab. 2023 Apr;43(4):552-564. doi: 10.1177/0271678X221142527. Epub 2022 Nov 24. J Cereb Blood Flow Metab. 2023. PMID: 36420777 Free PMC article.
-
Patterns of renal and splanchnic sympathetic vasomotor activity in an animal model of survival to experimental sepsis.Braz J Med Biol Res. 2022 Jan 14;55:e11873. doi: 10.1590/1414-431X2021e11873. eCollection 2022. Braz J Med Biol Res. 2022. PMID: 35043862 Free PMC article.
-
Evaluation of the impact of surgical aortic valve replacement on short-term cardiovascular and cerebrovascular controls through spontaneous variability analysis.PLoS One. 2020 Dec 10;15(12):e0243869. doi: 10.1371/journal.pone.0243869. eCollection 2020. PLoS One. 2020. PMID: 33301491 Free PMC article.
-
Joint Analysis of Cardiovascular Control and Shear Wave Elastography to Determine Carotid Plaque Vulnerability.J Clin Med. 2025 Jan 20;14(2):648. doi: 10.3390/jcm14020648. J Clin Med. 2025. PMID: 39860656 Free PMC article.
-
Point/counterpoint: We should not take the direction of blood pressure change into consideration for dynamic cerebral autoregulation quantification.J Cereb Blood Flow Metab. 2022 Dec;42(12):2354-2356. doi: 10.1177/0271678X221123442. Epub 2022 Sep 13. J Cereb Blood Flow Metab. 2022. PMID: 36113047 Free PMC article.
References
-
- Barbic F., Heusser K., Marchi A., Zamuner A., Gauger P., Tank J., et al. (2015). Cardiovascular parameters and neural sympathetic discharge variability before orthostatic syncope: role of sympathetic baroreflex control to the vessels. Physiol. Meas. 36 633–641. 10.1088/0967-3334/36/4/633 - DOI - PMC - PubMed
-
- Bertinieri G., di Rienzo M., Cavallazzi A., Ferrari A. U., Pedotti A., Mancia G. (1985). A new approach to analysis of the arterial baroreflex. J. Hypertens. 33 S79–S81. - PubMed
LinkOut - more resources
Full Text Sources
Research Materials
Miscellaneous