

Cognitive Profiles and Functional Connectivity in First-Episode Schizophrenia Spectrum Disorders - Linking Behavioral and Neuronal Data
- PMID: 31001171
- PMCID: PMC6454196
- DOI: 10.3389/fpsyg.2019.00689
Cognitive Profiles and Functional Connectivity in First-Episode Schizophrenia Spectrum Disorders - Linking Behavioral and Neuronal Data
Abstract
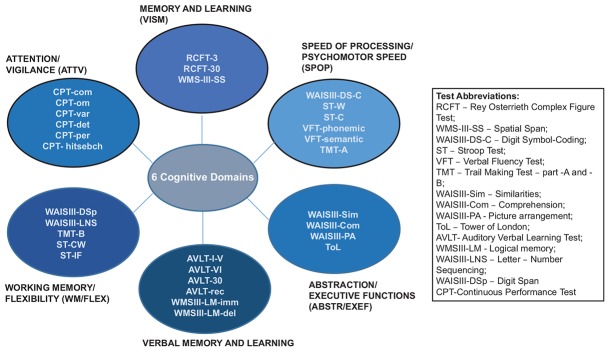
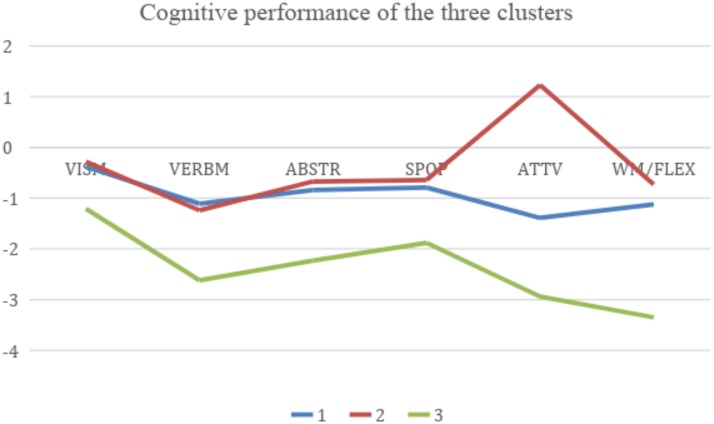
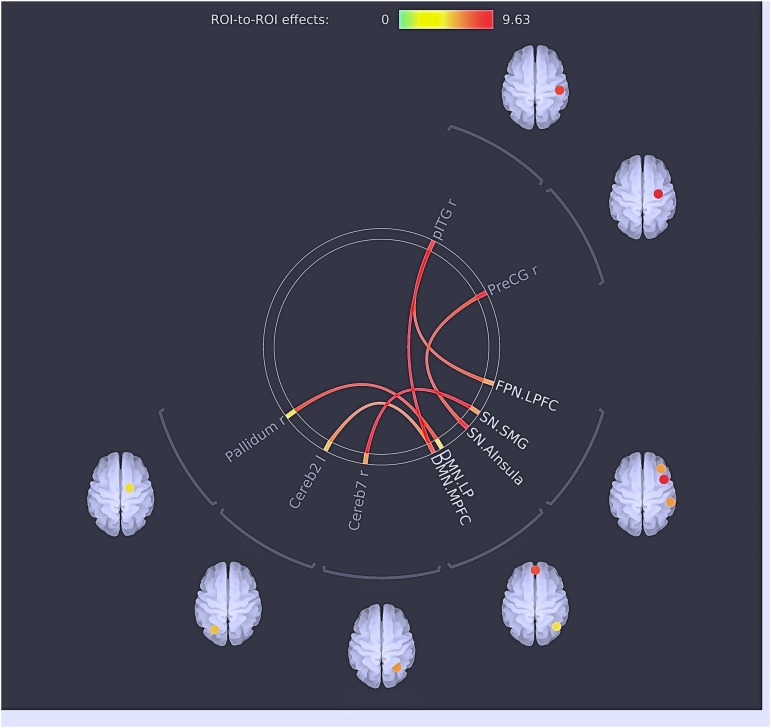
The character of cognitive deficit in schizophrenia is not clear due to the heterogeneity in research results. In heterogeneous conditions, the cluster solution allows the classification of individuals based on profiles. Our aim was to examine the cognitive profiles of first-episode schizophrenia spectrum disorder (FES) subjects based on cluster analysis, and to correlate these profiles with clinical variables and resting state brain connectivity, as measured with magnetic resonance imaging. A total of 67 FES subjects were assessed with a neuropsychological test battery and on clinical variables. The results of the cognitive domains were cluster analyzed. In addition, functional connectivity was calculated using ROI-to-ROI analysis with four groups: Three groups were defined based on the cluster analysis of cognitive performance and a control group with a normal cognitive performance. The connectivity was compared between the patient clusters and controls. We found different cognitive profiles based on three clusters: Cluster 1: decline in the attention, working memory/flexibility, and verbal memory domains. Cluster 2: decline in the verbal memory domain and above average performance in the attention domain. Cluster 3: generalized and severe deficit in all of the cognitive domains. FES diagnoses were distributed among all of the clusters. Cluster comparisons in neural connectivity also showed differences between the groups. Cluster 1 showed both hyperconnectivity between the cerebellum and precentral gyrus, the salience network (SN) (insula cortex), and fronto-parietal network (FPN) as well as between the PreCG and SN (insula cortex) and hypoconnectivity between the default mode network (DMN) and seeds of SN [insula and supramarginal gyrus (SMG)]; Cluster 2 showed hyperconnectivity between the DMN and cerebellum, SN (insula) and precentral gyrus, and FPN and IFG; Cluster 3 showed hypoconnectivity between the DMN and SN (insula) and SN (SMG) and pallidum. The cluster solution confirms the prevalence of a cognitive decline with different patterns of cognitive performance, and different levels of severity in FES. Moreover, separate behavioral cognitive subsets can be linked to patterns of brain functional connectivity.
Keywords: cluster analysis; cognitive deficit; cognitive profiles; first episodes; heterogeneity; resting state functional connectivity; schizophrenia.
Figures

Similar articles
-
Aberrant resting-state functional connectivity of salience network in first-episode schizophrenia.Brain Imaging Behav. 2020 Oct;14(5):1350-1360. doi: 10.1007/s11682-019-00040-8. Brain Imaging Behav. 2020. PMID: 30689171
-
Effects of Sleep Deprivation on Working Memory: Change in Functional Connectivity Between the Dorsal Attention, Default Mode, and Fronto-Parietal Networks.Front Hum Neurosci. 2020 Oct 12;14:360. doi: 10.3389/fnhum.2020.00360. eCollection 2020. Front Hum Neurosci. 2020. PMID: 33192381 Free PMC article.
-
Abnormal Resting-State Functional Connectivity of Insular Subregions and Disrupted Correlation with Working Memory in Adults with Attention Deficit/Hyperactivity Disorder.Front Psychiatry. 2017 Oct 11;8:200. doi: 10.3389/fpsyt.2017.00200. eCollection 2017. Front Psychiatry. 2017. PMID: 29075206 Free PMC article.
-
Dysregulation within the salience network and default mode network in hyperthyroid patients: a follow-up resting-state functional MRI study.Brain Imaging Behav. 2020 Feb;14(1):30-41. doi: 10.1007/s11682-018-9961-6. Brain Imaging Behav. 2020. PMID: 30259292 Review.
-
The role of the salience network in cognitive and affective deficits.Front Hum Neurosci. 2023 Mar 20;17:1133367. doi: 10.3389/fnhum.2023.1133367. eCollection 2023. Front Hum Neurosci. 2023. PMID: 37020493 Free PMC article. Review.
Cited by
-
Heterogeneity of Outcomes and Network Connectivity in Early-Stage Psychosis: A Longitudinal Study.Schizophr Bull. 2021 Jan 23;47(1):138-148. doi: 10.1093/schbul/sbaa079. Schizophr Bull. 2021. PMID: 32572485 Free PMC article.
-
Smoking and attention in schizophrenia spectrum disorders: What are we neglecting?Front Psychol. 2023 Mar 30;14:1114473. doi: 10.3389/fpsyg.2023.1114473. eCollection 2023. Front Psychol. 2023. PMID: 37063581 Free PMC article.
-
The Performance of Visual Perceptual Tasks in Patients with Schizotypal Personality Disorder.Psychol Russ. 2021 Jun 30;14(2):42-58. doi: 10.11621/pir2021.0204. eCollection 2021. Psychol Russ. 2021. PMID: 36810993 Free PMC article.
-
Effects of ulotaront on brain circuits of reward, working memory, and emotion processing in healthy volunteers with high or low schizotypy.Schizophrenia (Heidelb). 2023 Aug 7;9(1):49. doi: 10.1038/s41537-023-00385-6. Schizophrenia (Heidelb). 2023. PMID: 37550314 Free PMC article.
-
Verbal memory measurement towards digital perspectives in first-episode psychosis: A review.Schizophr Res Cogn. 2020 Apr 15;21:100177. doi: 10.1016/j.scog.2020.100177. eCollection 2020 Sep. Schizophr Res Cogn. 2020. PMID: 32322540 Free PMC article. Review.
References
-
- Andreasen N. C., O’Leary D. S., Cizadlo T., Arndt S., Rezai K., Ponto L. L., et al. (1996). Schizophrenia and cognitive dysmetria: a positron-emission tomography study of dysfunctional prefrontal-thalamic-cerebellar circuitry. Proc. Natl. Acad. Sci. U.S.A. 93 9985–9990. 10.1073/pnas.93.18.9985 - DOI - PMC - PubMed
LinkOut - more resources
Full Text Sources
Miscellaneous