. 2019 Apr 3:10:655.
doi: 10.3389/fmicb.2019.00655. eCollection 2019.

Diverse Large HIV-1 Non-subtype B Clusters Are Spreading Among Men Who Have Sex With Men in Spain

Collaborators, Affiliations

Diverse Large HIV-1 Non-subtype B Clusters Are Spreading Among Men Who Have Sex With Men in Spain

Elena Delgado et al. Front Microbiol. .

Abstract

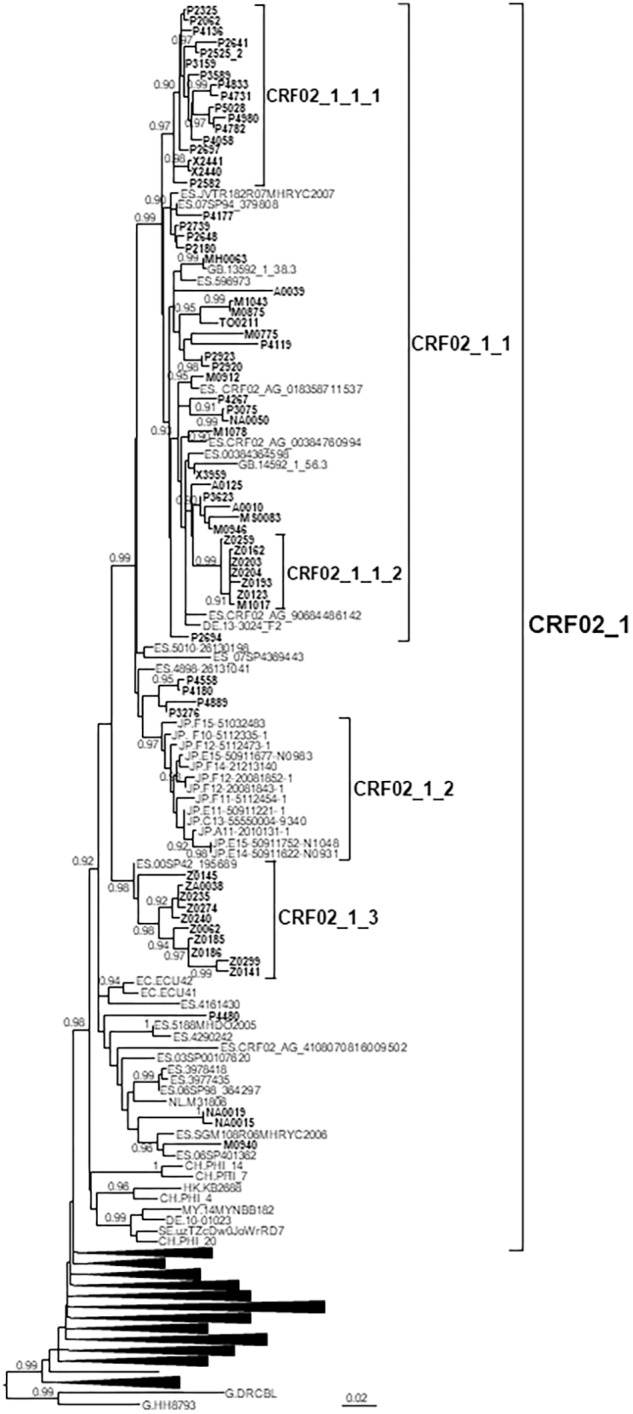
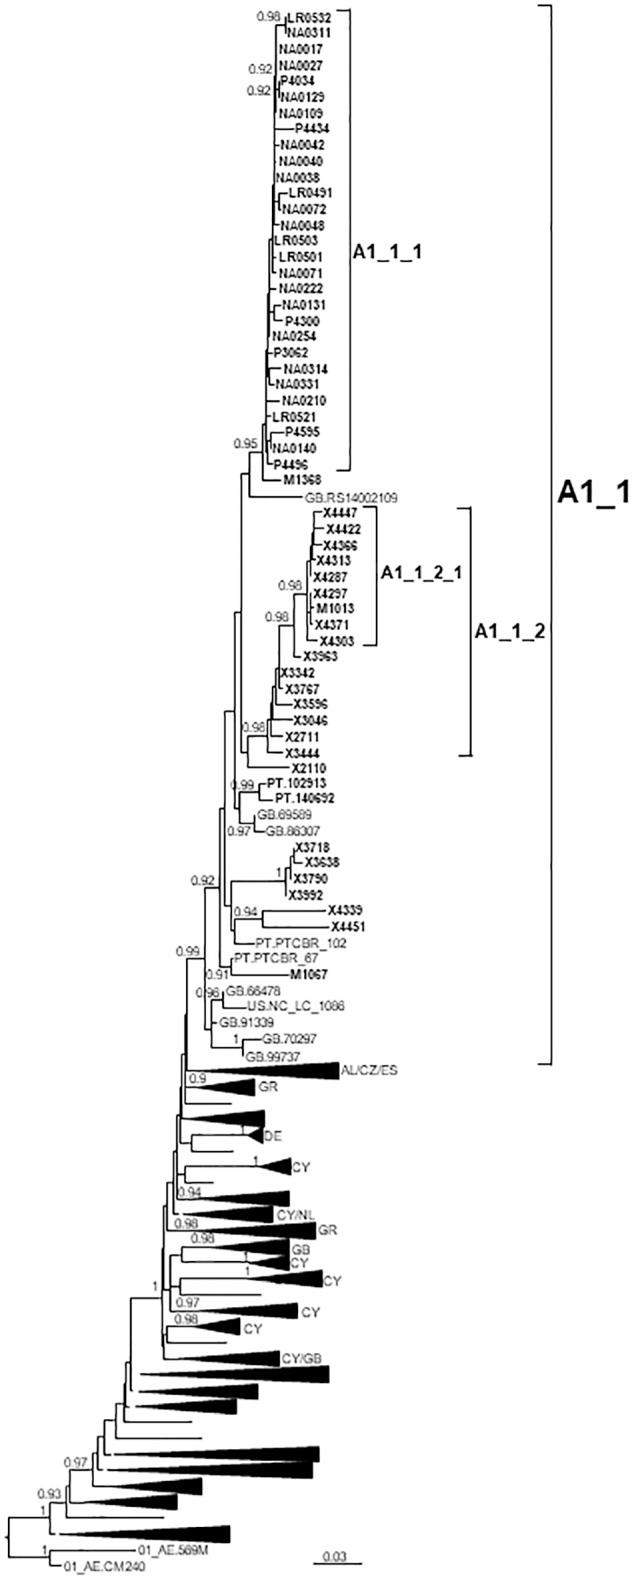
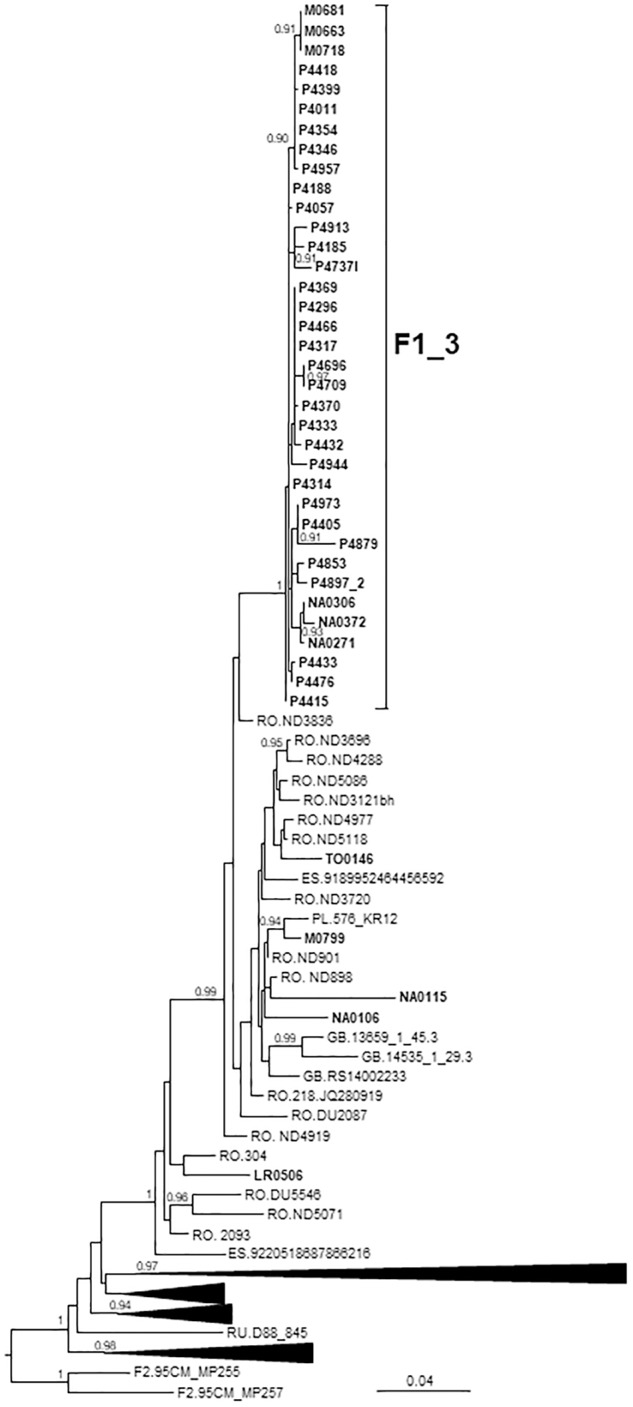
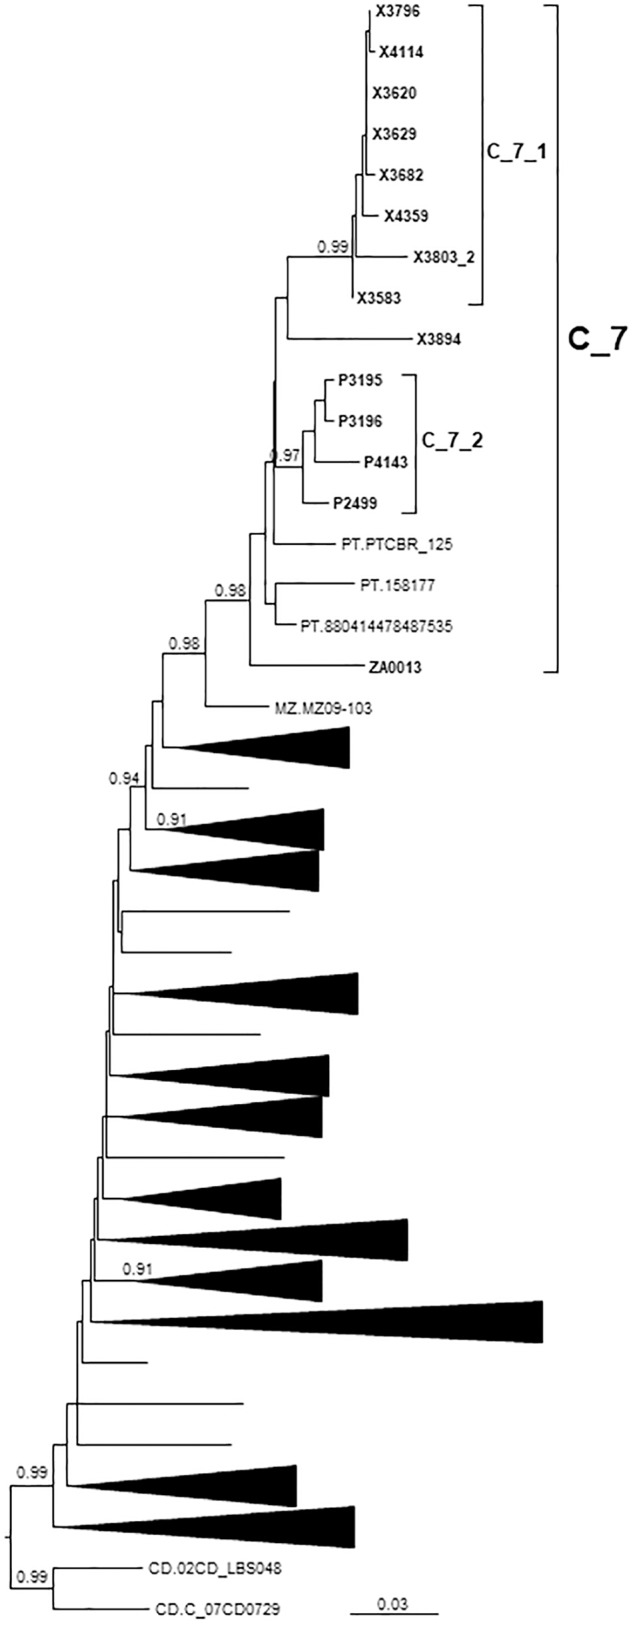
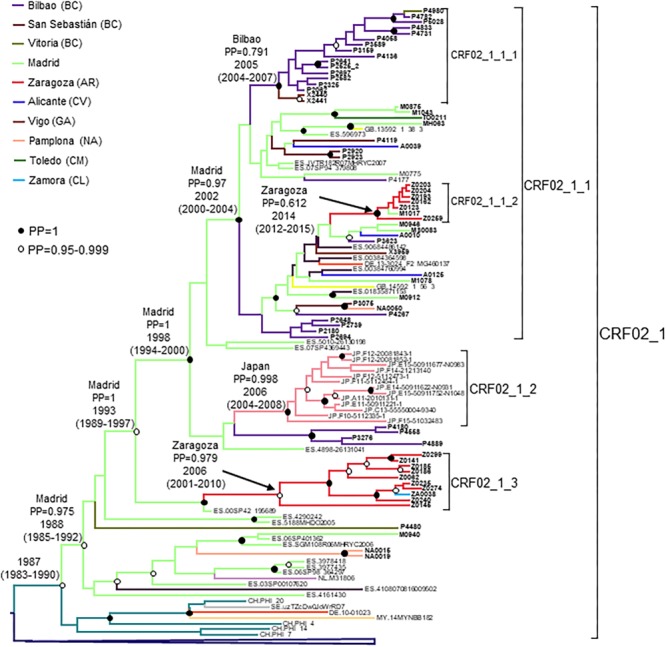
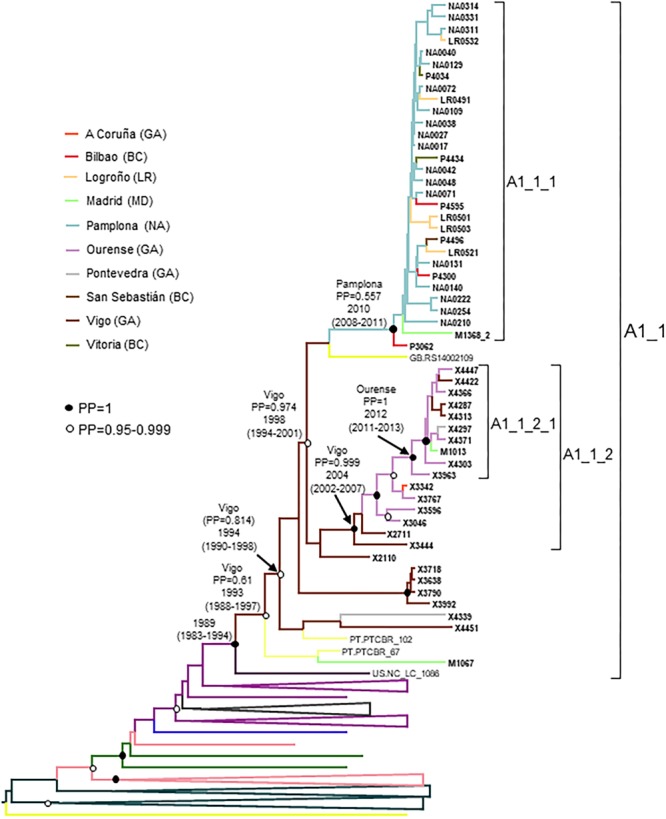
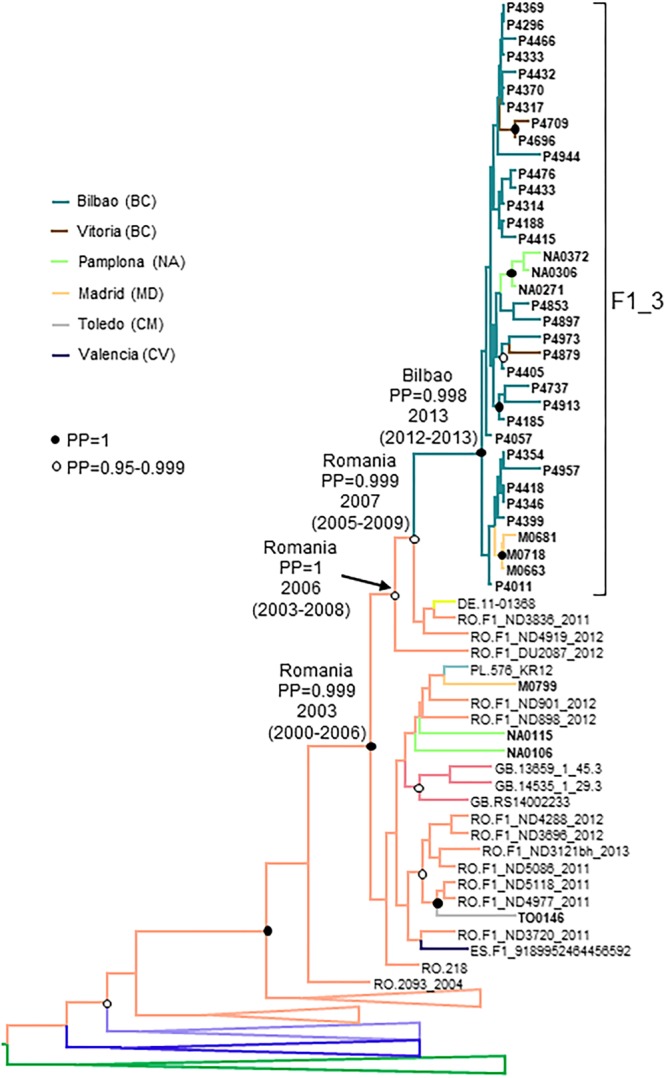
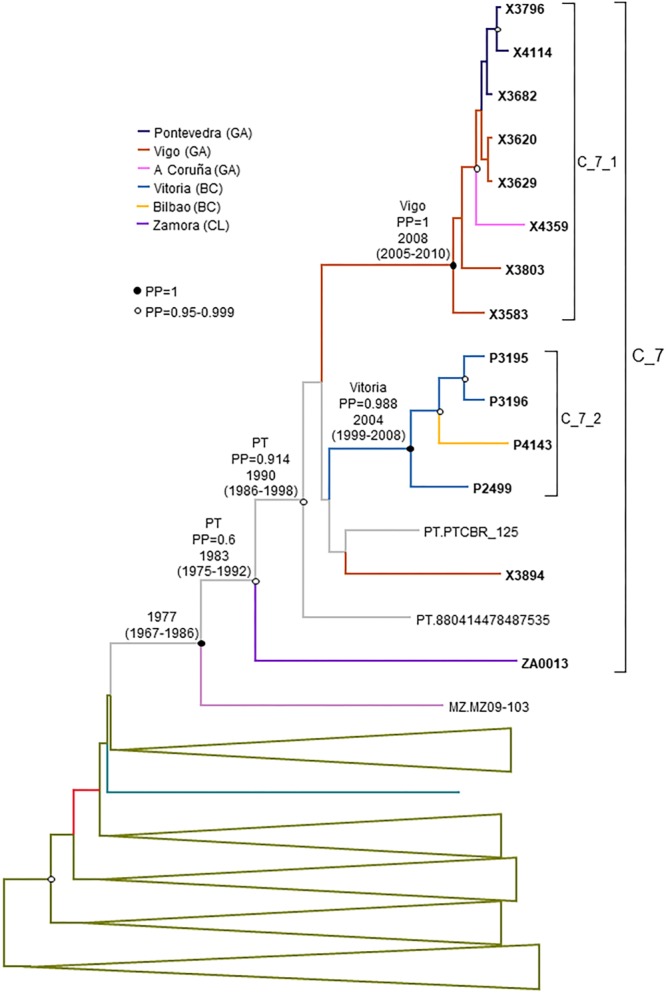
In Western Europe, the HIV-1 epidemic among men who have sex with men (MSM) is dominated by subtype B. However, recently, other genetic forms have been reported to circulate in this population, as evidenced by their grouping in clusters predominantly comprising European individuals. Here we describe four large HIV-1 non-subtype B clusters spreading among MSM in Spain. Samples were collected in 9 regions. A pol fragment was amplified from plasma RNA or blood-extracted DNA. Phylogenetic analyses were performed via maximum likelihood, including database sequences of the same genetic forms as the identified clusters. Times and locations of the most recent common ancestors (MRCA) of clusters were estimated with a Bayesian method. Five large non-subtype B clusters associated with MSM were identified. The largest one, of F1 subtype, was reported previously. The other four were of CRF02_AG (CRF02_1; n = 115) and subtypes A1 (A1_1; n = 66), F1 (F1_3; n = 36), and C (C_7; n = 17). Most individuals belonging to them had been diagnosed of HIV-1 infection in the last 10 years. Each cluster comprised viruses from 3 to 8 Spanish regions and also comprised or was related to viruses from other countries: CRF02_1 comprised a Japanese subcluster and viruses from 8 other countries from Western Europe, Asia, and South America; A1_1 comprised viruses from Portugal, United Kingom, and United States, and was related to the A1 strain circulating in Greece, Albania and Cyprus; F1_3 was related to viruses from Romania; and C_7 comprised viruses from Portugal and was related to a virus from Mozambique. A subcluster within CRF02_1 was associated with heterosexual transmission. Near full-length genomes of each cluster were of uniform genetic form. Times of MRCAs of CRF02_1, A1_1, F1_3, and C_7 were estimated around 1986, 1989, 2013, and 1983, respectively. MRCA locations for CRF02_1 and A1_1 were uncertain (however initial expansions in Spain in Madrid and Vigo, respectively, were estimated) and were most probable in Bilbao, Spain, for F1_3 and Portugal for C_7. These results show that the HIV-1 epidemic among MSM in Spain is becoming increasingly diverse through the expansion of diverse non-subtype B clusters, comprising or related to viruses circulating in other countries.

Keywords: HIV-1; circulating recombinant forms; clusters; men who have sex with men; molecular epidemiology; phylodynamics; phylogeny; subtypes.


Figures

FIGURE 1
FIGURE 1
Maximum likelihood tree of PR-RT sequences of the CRF02_1 cluster. The tree was constructed with PhyML, with assessment of node support with the aLRT SH-like procedure. The analysis incorporates 513 CRF02_AG PR-RT sequences from databases that in preliminary analyses with FastTree branched closer to the CRF02_1 cluster and from NFLG sequences, and two subtype G sequences used to root the tree. For better viewing, clades outside of the CRF02_1 cluster are collapsed. Only aLRT SH-like node support values ≥ 0.9 are shown. Sequences obtained by us are in bold type. Sequences from databases are labeled with the two-letter ISO code of the country of sample collection followed by the sample name.
FIGURE 2
FIGURE 2
Maximum likelihood tree of PR-RT sequences of the A1_1 cluster. The tree was constructed with PhyML, with assessment of node support with the aLRT SH-like procedure. The analysis incorporates 338 A1 subsubtype PR-RT sequences from databases that in preliminary analyses with FastTree branched closer to the A1_1 cluster and from NFLG sequences, and two CRF01_AE sequences used to root the tree. For better viewing, clades outside of the A1_1 cluster are collapsed. Only aLRT SH-like node support values ≥ 0.90 are shown. Sequences obtained by us are in bold type. Sequences from databases are labeled with the two-letter ISO code of the country of sample collection followed by the sample name. Collapsed clades most closely related to the A1_1 cluster are labeled with the two-letter codes of the countries of sample collection, excluding countries represented by a single sequence.
FIGURE 3
FIGURE 3
Maximum likelihood tree of PR-RT of viruses of the F1_3 cluster. The tree was constructed with PhyML, with assessment of node support with the aLRT SH-like procedure. The analysis incorporates 358 PR-RT F1 subsubtype sequences from databases that in preliminary analyses with FastTree branched closer to the F1_3 cluster and from NFLG sequences, and two F2 subsubtype sequences used to root the tree. For better viewing, clades outside of the F1_3 cluster, excluding those most closely related to the F1_3 cluster, are collapsed. Only aLRT SH-like node support values ≥ 0.90 are shown. Sequences obtained by us are in bold type. Sequences from databases are labeled with the two-letter ISO code of the country of sample collection followed by the sample name.
FIGURE 4
FIGURE 4
Maximum likelihood tree of PR-RT of viruses of the C_7 cluster. The tree was constructed with PhyML, with assessment of node support with the aLRT SH-like procedure. The analysis incorporates 312 PR-RT subtype C sequences from databases that in preliminary analyses with FastTree branched closer to the C_7 cluster and from NFLG sequences, and two subtype C sequences from the Democratic Republic of Congo used to root the tree. For better viewing, clades outside of the C_7 cluster are collapsed. Only aLRT SH-like node support values ≥ 0.90 are shown. Sequences obtained by us are in bold type. Sequences from databases are labeled with the two-letter ISO code of the country of sample collection followed by sample name.
FIGURE 5
FIGURE 5
Maximum clade credibility tree of PR-RT sequences of the CRF02_1 cluster. The tree also includes 40 other PR-RT CRF02_AG sequences from databases. For better viewing, the clade comprising viruses branching outside of the CRF02_1 cluster is collapsed. Sequences obtained by us are in bold type. Sequences from databases are labeled with the two-letter ISO code of the country of sample collection followed by the sample name. Nodes supported by PP = 1 and PP = 0.95–0.999 are marked with filled and unfilled circles, respectively. Colors of terminal and internal branches represent sampling locations and most probable locations of the corresponding nodes, respectively, according to the legend on the left. For the nodes corresponding to CRF02_1 cluster and its major subclusters, the location with the highest PP (if > 0.5) and the tMRCAs (with 95% HPD intervals) are indicated above or close to the subtending branches.
FIGURE 6
FIGURE 6
Maximum clade credibility tree of PR-RT sequences of the A1_1 cluster. The tree also includes a sequence from US that in ML trees branched close to the A1_1 cluster (samples from United Kingdom were excluded because no information on time of sample collection was available), and A1 subsubtype PR-RT sequences from NFLG sequences from databases. For better viewing, clades outside of the A1_1 cluster are collapsed. Sequences obtained by us are in bold type. Sequences from databases are labeled with the two-letter ISO code of country of sample collection followed by sample name. Clades most closely related to the A1_1 cluster are labeled with the two-letter ISO code of the sampling countries of viruses contained in it. Nodes supported by PP = 1 and PP = 0.95-0.999 are marked with filled and unfilled circles, respectively. Colors of terminal and internal branches represent sampling locations and most probable locations of the corresponding nodes, respectively, according to the legend on the left. For the nodes corresponding to the A1_1 cluster and its major subclusters, the location with the highest PP (if > 0.5) and the tMRCAs (with 95% HPD intervals) are indicated above or close to the subtending branches.
FIGURE 7
FIGURE 7
Maximum clade credibility tree of PR-RT sequences of the F1_3 cluster. The tree also includes F1 subsubtype sequences from databases branching close to the F1_3 cluster and F1_3 subsubtype PR-RT sequences from NFLG sequences from databases. For better viewing, clades outside of the F1 cluster are collapsed, except those most closely related to the F1_3 cluster. Sequences obtained by us are in bold type. Sequences from databases are labeled with the two-letter ISO code of country of sample collection followed by sample name. Nodes supported by PP = 1 and PP = 0.95–0.999 are marked with filled and unfilled circles, respectively. Colors of terminal and internal branches represent sampling locations and most probable locations of the corresponding nodes, respectively, according to the legend on the left. For the nodes corresponding to the F1_3 cluster and the clades within which it is contained, the location posterior probabilities and the tMRCAs (with 95% HPD intervals) are indicated above or close to the subtending branches.
FIGURE 8
FIGURE 8
Maximum clade credibility tree of PR-RT sequences of the C_7 cluster. The tree also includes a subtype C sequences from Mozambique that in ML trees branched close to the C_7 cluster and subtype C PR-RT sequences from NFLG sequences from databases. For better viewing, clades outside of the C_7 cluster are collapsed. Sequences obtained by us are in bold type. Sequences from databases are labeled with the two-letter ISO code of country of sample collection followed by sample name. Nodes supported by PP = 1 and PP = 0.95–0.999 are marked with filled and unfilled circles, respectively. Colors of terminal and internal branches represent sampling locations and most probable locations of the corresponding nodes, respectively, according to the legend on the left. For the nodes corresponding to the C_7 cluster and subclusters within it, the location posterior probability and the tMRCAs (with 95% HPD intervals) are indicated above or close to the subtending branches. tMRCA is also indicated for the node corresponding to the clade including the sample from Mozambique (most probable location is omitted, since its PP is below 0.5).
FIGURE 9
FIGURE 9
Bootscan analyses of NFLG sequences of viruses from the identified clusters. Virus names, with cluster in parentheses, are above each plot. A window of 400 nt was used for viruses of the A1_1, F1_3, and C_7 clusters, and of 600 nt for viruses of the CRF02_1 cluster, sliding in 20 nt increments. The horizontal axis represents the nucleotide position in the HXB2 proviral genome of the window’s midpoint. The vertical axis represents the bootstrap value supporting clustering with reference sequences, listed on the right of each plot.

Similar articles

Cited by

References

    1. Abecasis A. B., Martins A., Costa I., Carvalho A. P., Diogo I., Gomes P., et al. (2011). Molecular epidemiological analysis of paired pol/env sequences from Portuguese HIV type 1 patients. AIDS Res. Hum. Retroviruses 27 803–805. 10.1089/AID.2010.0312 - DOI - PubMed
    1. Abecasis A. B., Wensing A. M., Paraskevis D., Vercauteren J., Theys K., van de Vijver D. A., et al. (2013). HIV-1 subtype distribution and its demographic determinants in newly diagnosed patients in Europe suggest highly compartmentalized epidemics. Retrovirology 10:7. 10.1186/1742-4690-10-17 - DOI - PMC - PubMed
    1. Ambrosioni J., Junier T., Delhumeau C., Calmy A., Hirschel B., Zdobnov E., et al. (2012). Impact of highly active antiretroviral therapy on the molecular epidemiology of newly diagnosed HIV infections. AIDS 26 2079–2086. 10.1097/QAD.0b013e32835805b6 - DOI - PubMed
    1. Anisimova M., Gascuel O. (2006). Approximate likelihood-ratio test for branches: a fast, accurate, and powerful alternative. Syst. Biol. 55 539–552. 10.1080/10635150600755453 - DOI - PubMed
    1. Apetrei C., Loussert-Ajaka I., Collin G., Letourneur F., Duca M., Saragosti S., et al. (1997). HIV type 1 subtype F sequences in Romanian children and adults. AIDS Res. Hum. Retroviruses 13 363–365. 10.1089/aid.1997.13.363 - DOI - PubMed

LinkOut - more resources