

The Majority of Active Rhodobacteraceae in Marine Sediments Belong to Uncultured Genera: A Molecular Approach to Link Their Distribution to Environmental Conditions
- PMID: 31001232
- PMCID: PMC6454203
- DOI: 10.3389/fmicb.2019.00659
The Majority of Active Rhodobacteraceae in Marine Sediments Belong to Uncultured Genera: A Molecular Approach to Link Their Distribution to Environmental Conditions
Abstract
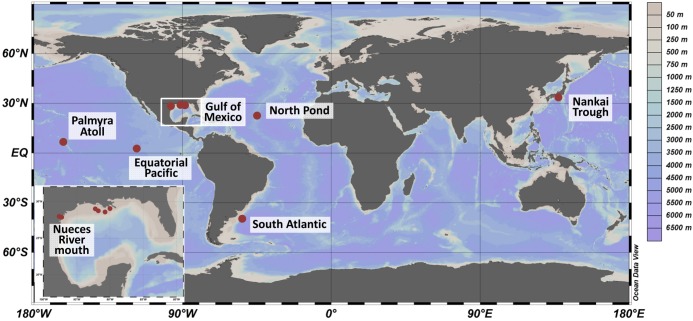
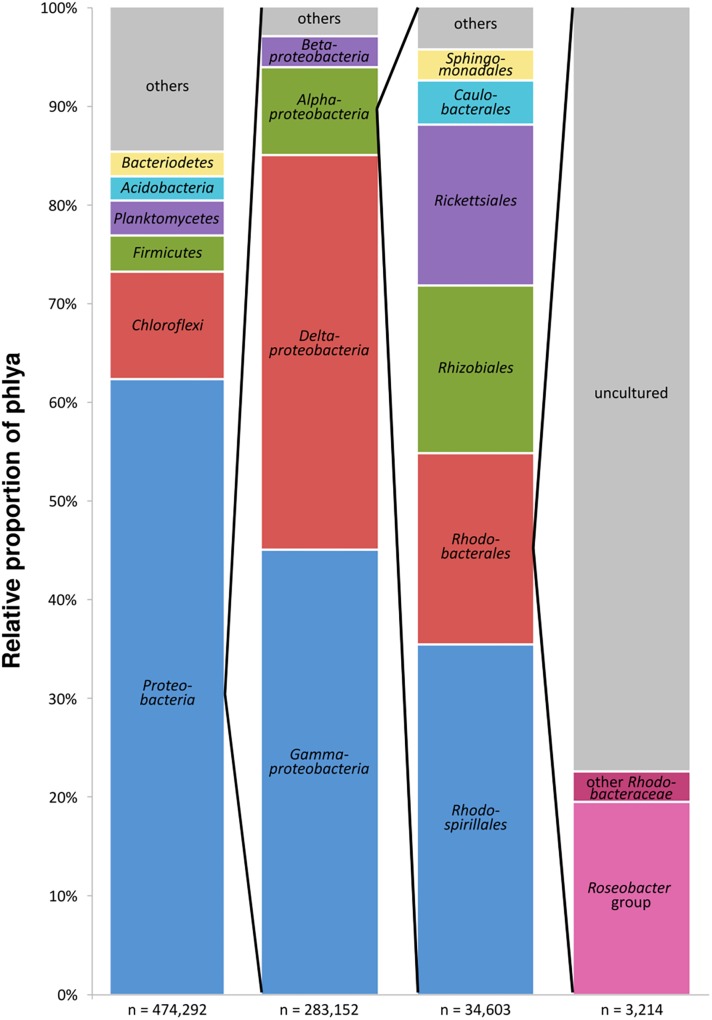
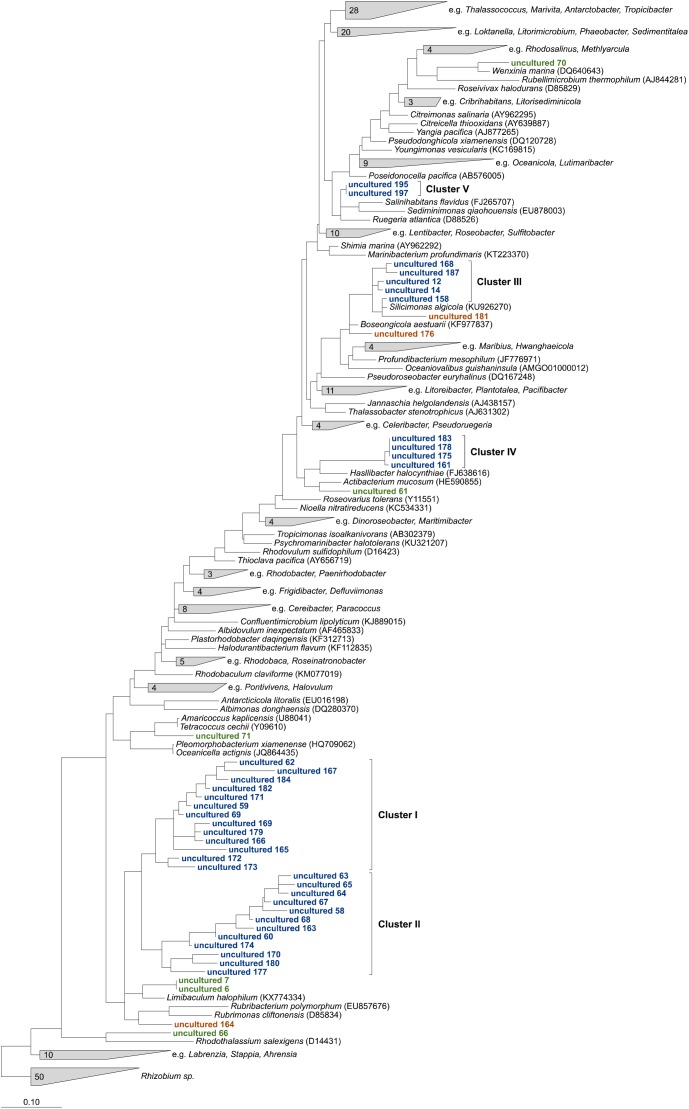
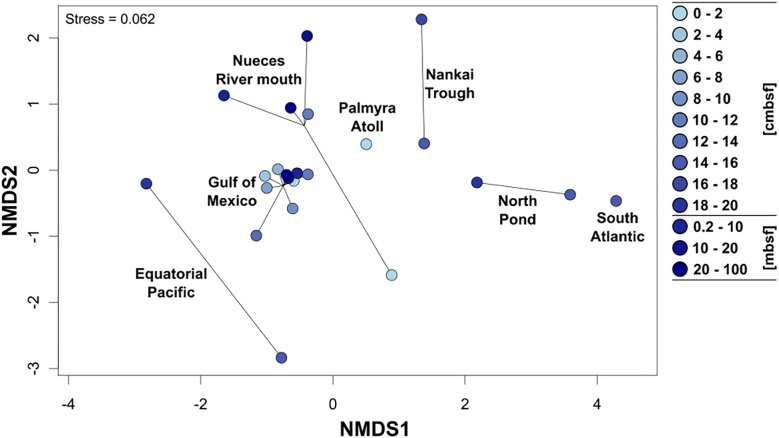
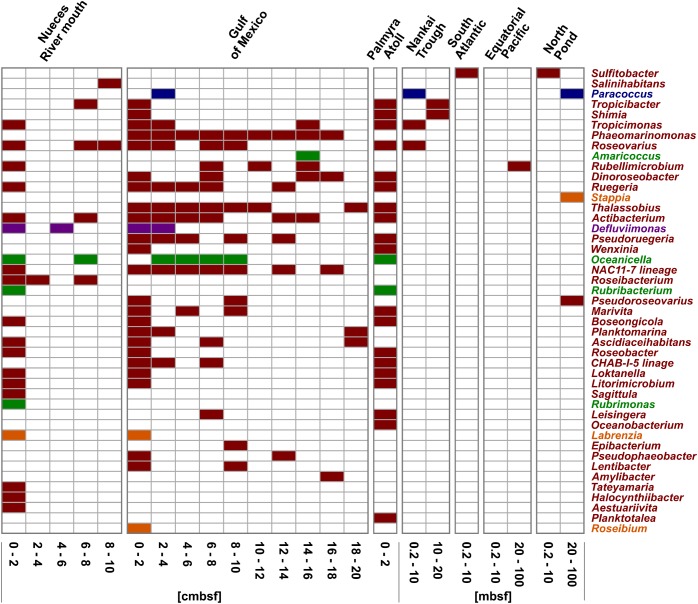
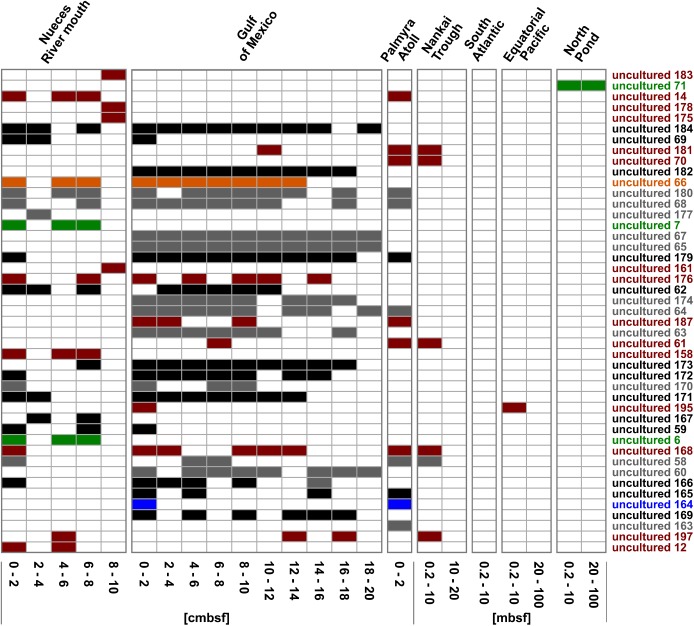
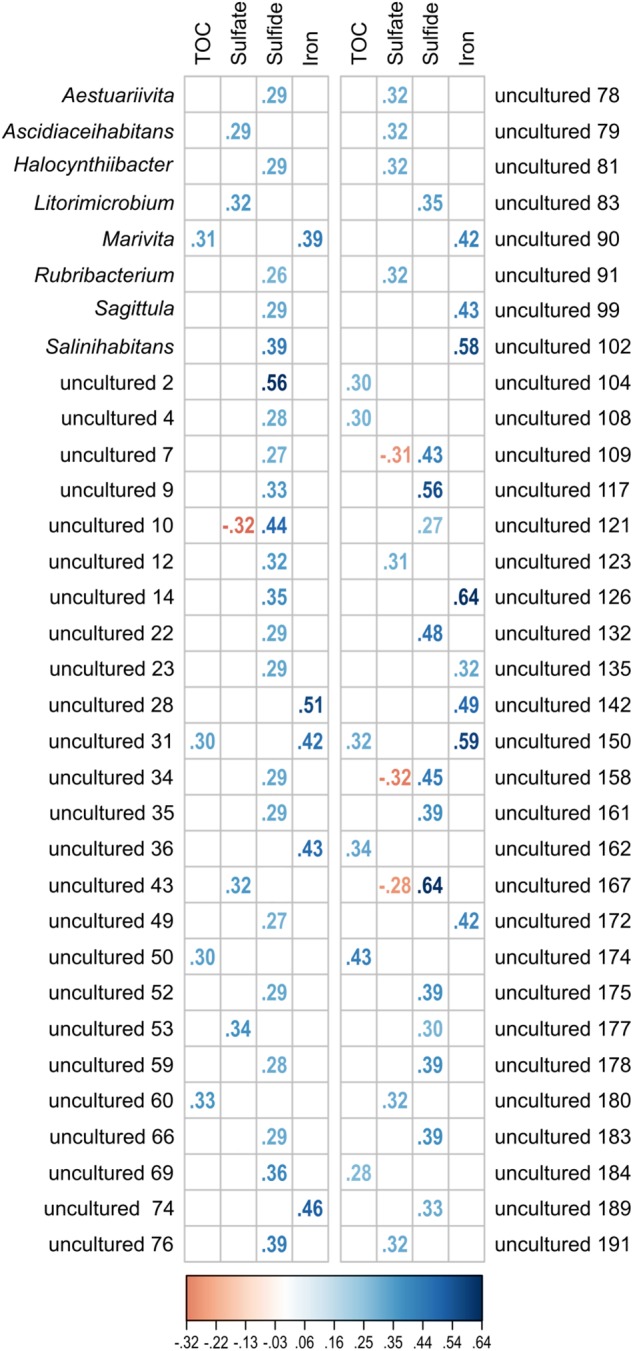
General studies on benthic microbial communities focus on fundamental biogeochemical processes or the most abundant constituents. Thereby, minor fractions such as the Rhodobacteraceae are frequently neglected. Even though this family belongs to the most widely distributed bacteria in the marine environment, their proportion on benthic microbial communities is usually within or below the single digit range. Thus, knowledge on these community members is limited, even though their absolute numbers might exceed those from the pelagic zone by orders of magnitudes. To unravel the distribution and diversity of benthic, metabolically active Rhodobacteraceae, we have now analyzed an already existing library of bacterial 16S rRNA transcripts. The dataset originated from 154 individual sediment samples comprising seven oceanic regions and a broad variety of environmental conditions. Across all samples, a total of 0.7% of all 16S rRNA transcripts was annotated as Rhodobacteraceae. Among those, Sulfitobacter, Paracoccus, and Phaeomarinomonas were the most abundant cultured representatives, but the majority (78%) was affiliated to uncultured family members. To define them, the 45 most abundant Rhodobacteraceae-OTUs assigned as "uncultured" were phylogenetically assembled in new clusters. Their next relatives particularly belonged to different subgroups other than the Roseobacter group, reflecting a large part of the hidden diversity within the benthic Rhodobacteraceae with unknown functions. The general composition of active Rhodobacteraceae communities was found to be specific for the geographical location, exhibiting a decreasing richness with sediment depth. One-third of the Rhodobacteraceae-OTUs significantly responded to the prevailing redox regime, suggesting an adaption to anoxic conditions. A possible approach to predict their physiological properties is to identify the metabolic capabilities of their nearest relatives. Those need to be proven by physiological experiments, as soon an isolate is available. Because many uncultured members of these subgroups likely thrive under anoxic conditions, in future research, a molecular-guided cultivation strategy can be pursued to isolate novel Rhodobacteraceae from sediments.
Keywords: benthic; diversity; microbial communities; phylogeny; pyrosequencing.
Figures
Similar articles
-
Rhodobacteraceae on the marine brown alga Fucus spiralis are abundant and show physiological adaptation to an epiphytic lifestyle.Syst Appl Microbiol. 2017 Sep;40(6):370-382. doi: 10.1016/j.syapm.2017.05.006. Epub 2017 Jun 15. Syst Appl Microbiol. 2017. PMID: 28641923
-
The Biogeographical Distribution of Benthic Roseobacter Group Members along a Pacific Transect Is Structured by Nutrient Availability within the Sediments and Primary Production in Different Oceanic Provinces.Front Microbiol. 2017 Dec 18;8:2550. doi: 10.3389/fmicb.2017.02550. eCollection 2017. Front Microbiol. 2017. PMID: 29326679 Free PMC article.
-
Distinct compositions of free-living, particle-associated and benthic communities of the Roseobacter group in the North Sea.FEMS Microbiol Ecol. 2016 Jan;92(1):fiv145. doi: 10.1093/femsec/fiv145. Epub 2015 Nov 24. FEMS Microbiol Ecol. 2016. PMID: 26607167
-
Patterns in Benthic Microbial Community Structure Across Environmental Gradients in the Beaufort Sea Shelf and Slope.Front Microbiol. 2021 Jan 28;12:581124. doi: 10.3389/fmicb.2021.581124. eCollection 2021. Front Microbiol. 2021. PMID: 33584606 Free PMC article.
-
Phylogenetically Novel Uncultured Microbial Cells Dominate Earth Microbiomes.mSystems. 2018 Sep 25;3(5):e00055-18. doi: 10.1128/mSystems.00055-18. eCollection 2018 Sep-Oct. mSystems. 2018. PMID: 30273414 Free PMC article.
Cited by
-
Genome Analysis of Celeribacter sp. PS-C1 Isolated from Sekinchan Beach in Selangor, Malaysia, Reveals Its β-Glucosidase and Licheninase Activities.Microorganisms. 2022 Feb 10;10(2):410. doi: 10.3390/microorganisms10020410. Microorganisms. 2022. PMID: 35208867 Free PMC article.
-
Distribution, abundance, and ecogenomics of the Palauibacterales, a new cosmopolitan thiamine-producing order within the Gemmatimonadota phylum.mSystems. 2023 Aug 31;8(4):e0021523. doi: 10.1128/msystems.00215-23. Epub 2023 Jun 22. mSystems. 2023. PMID: 37345931 Free PMC article.
-
Pikeienuella piscinae gen. nov., sp. nov., a novel genus in the family Rhodobacteraceae.J Microbiol. 2021 Jun;59(6):546-551. doi: 10.1007/s12275-021-0678-7. Epub 2021 Apr 20. J Microbiol. 2021. PMID: 33877579
-
Depth wide distribution and metabolic potential of chemolithoautotrophic microorganisms reactivated from deep continental granitic crust underneath the Deccan Traps at Koyna, India.Front Microbiol. 2022 Nov 24;13:1018940. doi: 10.3389/fmicb.2022.1018940. eCollection 2022. Front Microbiol. 2022. PMID: 36504802 Free PMC article.
-
Evidence That Microorganisms at the Animal-Water Interface Drive Sea Star Wasting Disease.Front Microbiol. 2021 Jan 6;11:610009. doi: 10.3389/fmicb.2020.610009. eCollection 2020. Front Microbiol. 2021. PMID: 33488550 Free PMC article.
References
-
- Bakenhus I., Dlugosch L., Billerbeck S., Giebel H. A., Milke F., Simon M. (2017). Composition of total and cell-proliferating bacterioplankton community in early summer in the North Sea - Roseobacters are the most active component. Front. Microbiol. 8:14. 10.3389/fmicb.2017.01771 - DOI - PMC - PubMed
LinkOut - more resources
Full Text Sources