. 2019 Mar 29:10:630.
doi: 10.3389/fimmu.2019.00630. eCollection 2019.

PD-1 Primarily Targets TCR Signal in the Inhibition of Functional T Cell Activation

Affiliations

PD-1 Primarily Targets TCR Signal in the Inhibition of Functional T Cell Activation

Reina Mizuno et al. Front Immunol. .

Abstract

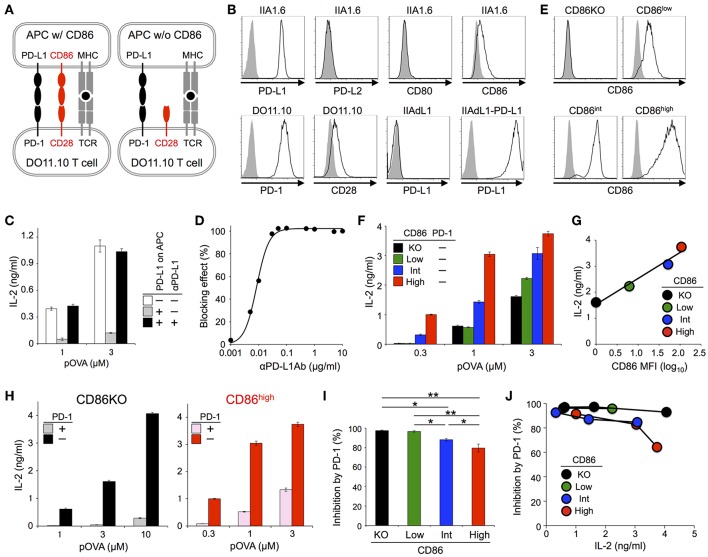
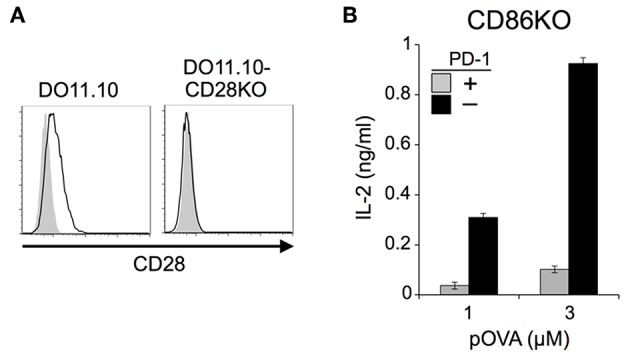
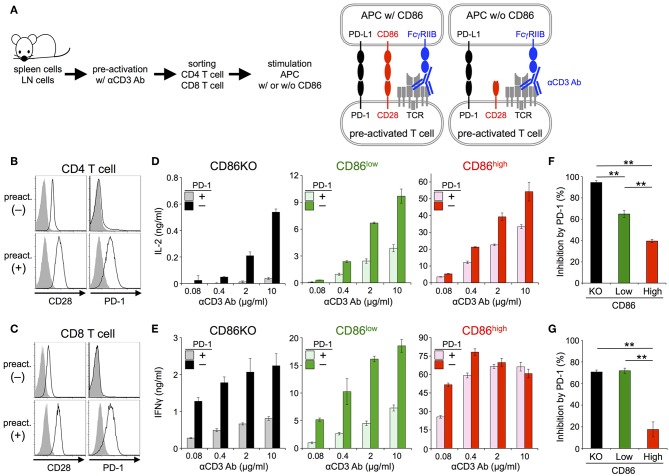
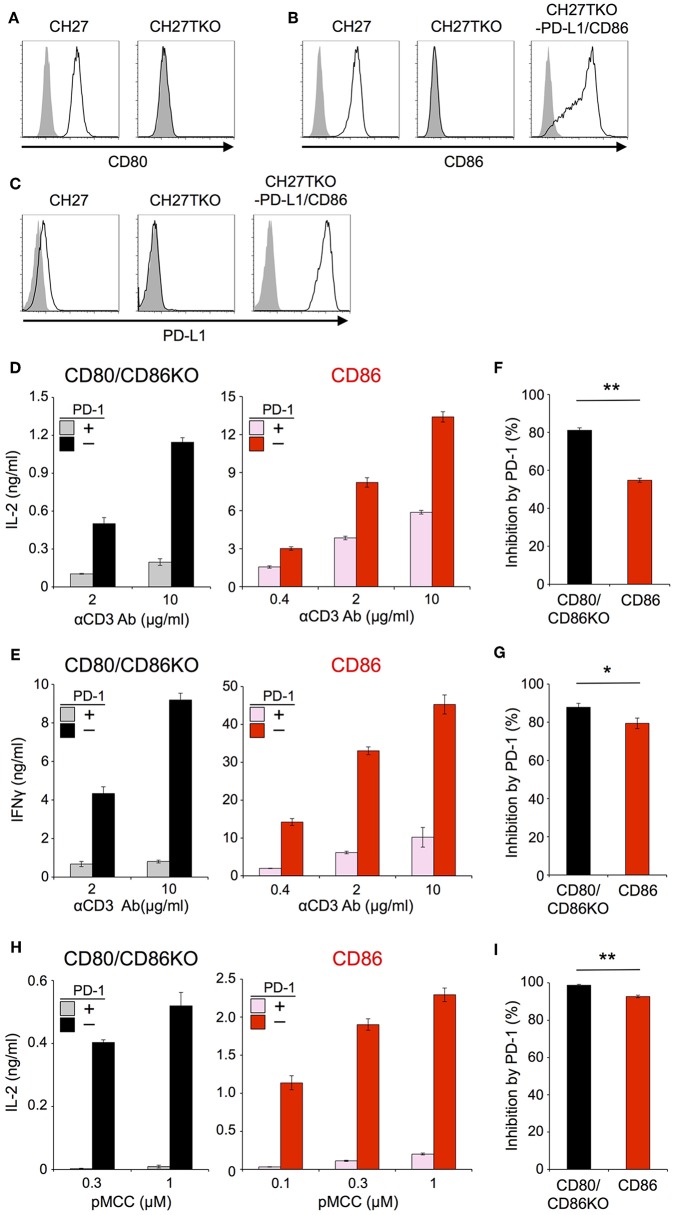
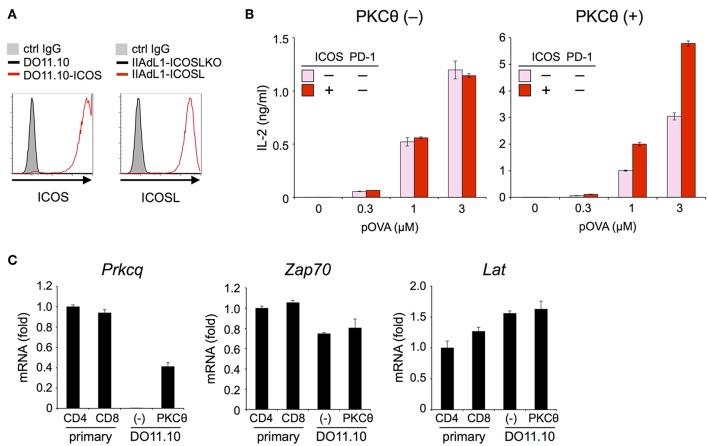
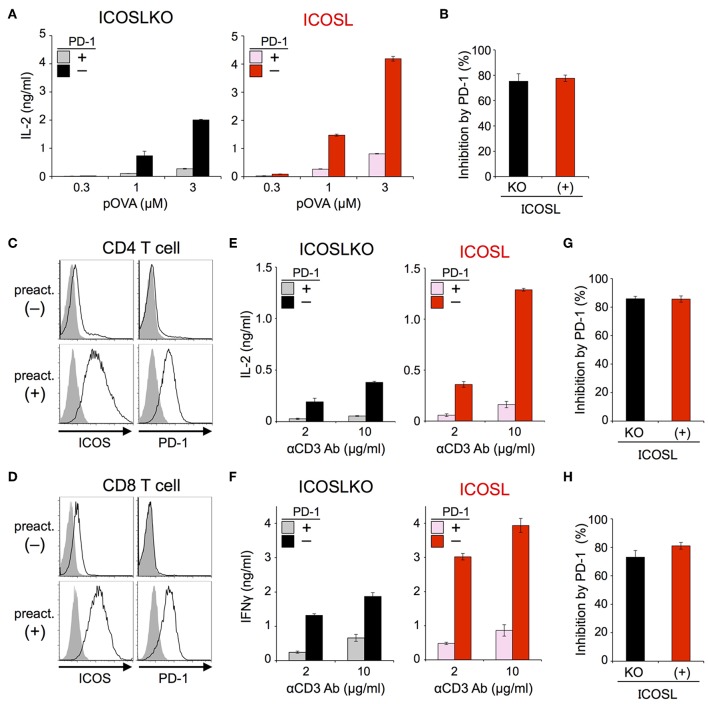
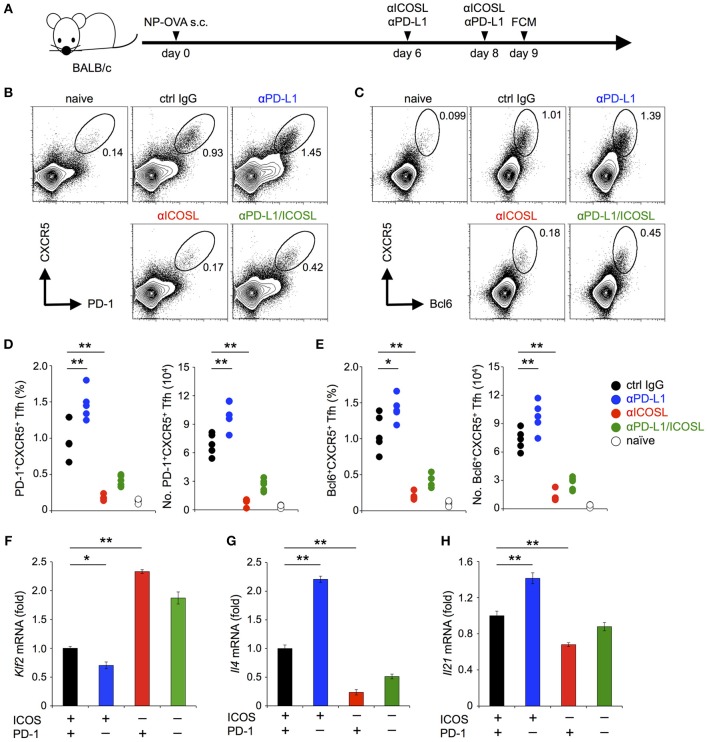
Cancer-immunotherapy targeting programmed cell death 1 (PD-1) activates tumor-specific T cells and provides clinical benefits in various cancers. However, the molecular basis of PD-1 function is still enigmatic. Especially, it is unclear which signaling pathway PD-1 primarily targets. Besides, the capacity of PD-1 to inhibit the T cell receptor (TCR)-dependent activation of T cells in the presence of co-stimulation is also controversial. Here we used co-culture systems of T cells and antigen-presenting cells with targeted deletion and overexpression of co-receptors and ligands and examined the inhibitory potency of PD-1 against T cell activation upon TCR stimulation with CD28 and ICOS co-stimulation. As an unambiguous criterion of T cell activation, we used the acquisition of cytokine production capacity, which represents one of the most important functions of T cells. PD-1 inhibited functional T cell activation upon TCR stimulation in the absence as well as in the presence of CD28 co-stimulation, indicating that PD-1 can directly inhibit TCR signal. Notably, CD28 co-stimulation rather attenuated the efficiency of PD-1 in inhibiting TCR-dependent functional T cell activation. In addition, PD-1 inhibited TCR-dependent functional T cell activation with ICOS co-stimulation as efficiently as that with CD28 co-stimulation. Furthermore, we found that the maintenance of antigen-induced follicular helper T (TFH) cells that required ICOS co-stimulation was persistently restrained by PD-1 in vivo. These findings indicate that PD-1 primarily targets TCR signal in the inhibition of functional T cell activation. Thus, PD-1 functions as the rheostat of T cell activation rather than an inhibitor of a specific stimulatory co-receptor.

Keywords: CD28; ICOS; PD-1; T cell receptor; co-receptor; cytokine production; follicular helper T cell.


Figures

Figure 1
Figure 1
PD-1 inhibited the antigen-dependent functional activation of DO11.10 T cells less efficiently in the presence of CD28 co-stimulation. (A) Schematic representations of the antigen-dependent activation of DO11.10 T cells with or without CD28 engagement. (B) Expression levels of indicated co-receptors and ligands. (C) Inhibition of antigen-dependent activation of DO11.10 T cells by PD-1 engagement. IL-2 secretion from DO11.10 T cells in the absence (white) or presence (gray) of PD-1 engagement by PD-L1 on APCs. Anti-PD-L1 Ab completely blocked PD-1 effect (black). (D) Titration of anti-PD-L1 blocking Ab. (E) Expression levels of CD86 on IIA1.6 cells expressing CD86 to varying degrees. (F) Antigen-dependent activation of DO11.10 T cells in the absence of CD28 co-stimulation and the enhancement of the activation in a manner dependent on the amount of CD86 on APCs. (G) Correlation between the amount of secreted IL-2 and the expression level of CD86 on APCs. (H–J) Robust PD-1-mediated inhibition of IL-2 production from DO11.10 T cells in the absence CD28 co-stimulation and the partial attenuation of PD-1-mediated inhibitory effect by CD28 co-stimulation. IL-2 secretion from DO11.10 T cells upon stimulation with pOVA323−339-pulsed APCs lacking (left, black and gray) or expressing (right, red and pink) CD86 in the presence (gray and pink) or absence (black and red) of PD-1 engagement (H). The average percent PD-1-dependent inhibition of IL-2 production upon stimulation with indicated APCs pulsed with 0.3, 1, and 3 μM of pOVA323−339 (I). The percent PD-1-dependent inhibition is plotted in relation to the amount of IL-2 production in the absence of PD-1 engagement for indicated APCs (J). Data are the mean ± SEM of technical triplicates in one experiment. Data are representative of more than two independent experiments. *p < 0.05 and **p < 0.01 by one-way ANOVA with Tukey HSD test. Cells used in this figure are listed in Tables 2, 3.
Figure 2
Figure 2
PD-1 inhibited the antigen-dependent functional activation of DO11.10 T cells in the absence of CD28 co-stimulation. (A) Expression levels of CD28 on DO11.10 and DO11.10-CD28KO T cells. (B) PD-1-dependent inhibition of the antigen-dependent functional activation of DO11.10 T cells without CD28 co-stimulation. IL-2 secretion from DO11.10-CD28KO T cells upon stimulation with pOVA323−339-pulsed IIAdL1-CD86KO cells in the presence (gray) or absence (black) of PD-1 engagement. Data are the mean ± SEM of technical triplicates in one experiment. Data are representative of three independent experiments. Cells used in this figure are listed in Tables 2, 3.
Figure 3
Figure 3
PD-1 inhibited the TCR-dependent functional activation of primary T cells less efficiently in the presence of CD28 co-stimulation. (A) Schematic representations of the TCR-dependent activation of primary T cells. Pre-activated CD4+ and CD8+ T cells were stimulated with anti-CD3 Ab presented on APCs with or without CD86 expression. (B,C) Expression levels of CD28 and PD-1 on CD4+ (B) and CD8+ (C) T cells with (lower) or without (upper) pre-activation. (D–G) Robust PD-1-mediated inhibition of cytokine production from primary T cells in the absence CD28 co-stimulation and the partial attenuation of PD-1-mediated inhibitory effect by CD28 co-stimulation. IL-2 and IFNγ secretions from pre-activated primary CD4+ (D) and CD8+ (E) T cells, respectively upon TCR stimulation with no (left, black and gray), weak (middle, green and olive), and strong (right, red and pink) CD28 co-stimulation. PD-1-dependent inhibitory effect was evaluated by comparing amounts of cytokines in the presence (gray, olive, and pink) or absence (black, green, and red) of PD-1 engagement. The average percent PD-1-dependent inhibition of cytokine production upon stimulation with indicated APCs pulsed with 0.08, 0.4, 2, and 10 μg/ml of anti-CD3 Ab is shown for pre-activated primary CD4+ (F) and CD8+ (G) T cells. Data are the mean ± SEM of technical triplicates in one experiment. Data are representative of more than two independent experiments. **p < 0.01 by one-way ANOVA with Tukey HSD test. Cells used in this figure are listed in Tables 2, 3.
Figure 4
Figure 4
Stimulation of primary T cells using CH27 B lymphoma cells as APCs. (A–C) Expression of CD80 (A), CD86 (B), and PD-L1 (C) on CH27 cells. CH27 cells endogenously express CD80, CD86, and PD-L1. Genes for CD80, CD86, and PD-L1 were knocked-out in CH27TKO cells. (D–G) Robust PD-1-mediated inhibition of cytokine production from primary T cells in the absence of CD28 co-stimulation and the partial attenuation of PD-1-mediated inhibitory effect by CD28 co-stimulation. IL-2 and IFNγ secretion from pre-activated primary CD4+ (D) and CD8+ (E) T cells, respectively upon TCR-stimulation in the absence (left, black and gray) or presence (right, red and pink) of CD28 engagement. PD-1-dependent inhibitory effect was evaluated by comparing amounts of cytokines in the presence (gray and pink) or absence (black and red) of PD-1 engagement. The average percent PD-1-dependent inhibition of cytokine production upon stimulation with indicated APCs pulsed with 2 and 10 μg/ml of anti-CD3 Ab is shown for pre-activated primary CD4+ (F) and CD8+ (G) T cells. (H,I) PD-1-dependent inhibition of the antigen-dependent functional activation of 2B4.11 T cells without CD28 co-stimulation. CH27TKO cells with (right, red and pink) or without (left, black and gray) CD86 were pulsed with indicated amounts of pMCC and used to stimulate 2B4.11 T cells. IL-2 secretion in the presence (gray and pink) or absence (black and red) PD-1 engagement is shown (H). The percent PD-1-dependent inhibition denotes the average inhibitory effects with 0.3 and 1 μM of pMCC (I). Data are the mean ± SEM of technical triplicates in one experiment. Data are representative of two independent experiments. *p < 0.05 and **p < 0.01 by two-tailed unpaired Student's t-test. Cells used in this figure are listed in Tables 2, 3.
Figure 5
Figure 5
ICOS engagement augmented the antigen-dependent functional activation of DO11.10 T cells in the presence of PKCθ. (A) Expression levels of ICOS and ICOSL. (B) Increased antigen-dependent secretion of IL-2 from DO11.10-ICOS T cells by ICOS engagement in the presence of PKCθ. ICOS engagement increased the IL-2 secretion from DO11.10-ICOS T cells overexpressing PKCθ (right) but not from DO11.10-ICOS T cells lacking PKCθ expression (left). (C) Lack of Prkcq (PKCθ) expression in DO11.10 T cells. The expression levels of Prkcq, Zap70, and Lat in primary CD4+ and CD8+ T cells and DO11.10 T cells with or without PKCθ overexpression were quantified by qPCR. Fold changes in expression relative to primary CD4+ T cells are shown. Data are the mean ± SEM of technical triplicates in one experiment. Data are representative of two independent experiments. Cells used in this figure are listed in Tables 2, 3.
Figure 6
Figure 6
PD-1 efficiently inhibited the functional activation of DO11.10 and primary T cells upon TCR stimulation with ICOS co-stimulation. (A,B) PD-1-dependent inhibition of the functional activation of DO11.10 T cells upon antigen stimulation with ICOS co-stimulation. IL-2 secretion from DO11.10 T cells upon stimulation with pOVA323−339-pulsed APCs lacking (left, black and gray) or expressing (right, red and pink) ICOSL in the presence (gray and pink) or absence (black and red) of PD-1 engagement (A). The average percent PD-1-dependent inhibition of IL-2 production upon stimulation with indicated APCs pulsed with 0.3, 1, and 3 μM of pOVA323−339 (B). (C,D) Expression levels of ICOS and PD-1 on CD4+ (C) and CD8+ (D) T cells with (lower) or without (upper) pre-activation. (E–H) PD-1-dependent inhibition of the functional activation of primary T cells upon TCR stimulation with ICOS co-stimulation. IL-2 and IFNγ secretion from pre-activated primary CD4+ (E) and CD8+ (F) T cells, respectively upon TCR stimulation in the absence (left, black and gray) or presence (right, red and pink) of ICOS co-stimulation. PD-1-dependent inhibitory effect was evaluated by comparing amounts of cytokines in the presence (gray and pink) or absence (black and red) of PD-1 engagement. The average percent PD-1-dependent inhibition of cytokine production upon stimulation with indicated APCs pulsed with 2 and 10 μg/ml of anti-CD3 Ab is shown for pre-activated primary CD4+ (G) and CD8+ (H) T cells. Data are the mean ± SEM of technical triplicates in one experiment. Data are representative of more than two independent experiments. Cells used in this figure are listed in Tables 2, 3.
Figure 7
Figure 7
PD-1 restricted the maintenance of antigen-induced TFH cells that required ICOS co-stimulation. (A) Schematic representation of the experimental system to analyze PD-1 effects on the maintenance of antigen-induced TFH cells. Anti-ICOSL and anti-PD-L1 Abs were administrated independently or in combination on days 6 and 8 to analyze their effects on the maintenance of antigen-induced TFH cells. CD4+ T cells in draining lymph nodes were analyzed on day 9. (B–E) Increase of TFH cells by PD-1 blockade during their maintenance phase. Representative flowcytometric profiles (B,C) and statistics (D,E) of TFH cells identified by the expression of CXCR5 and PD-1 (B,D) and CXCR5 and Bcl6 (C,E) are shown for mice with the indicated treatment. (F–H) PD-1 blockade facilitated the down-regulation of Klf2 (F) and up-regulation of Il4 (G) and Il21 (H) upon TCR stimulation with ICOS co-stimulation. Pre-activated primary CD4+ T cells were stimulated with anti-CD3 Ab (2C11, 0.1 μg/ml) in the indicated combination of ICOS and PD-1 engagements for 6 h. T cells were purified and the expression of Klf2, Il4, and Il21 was quantified by qPCR. Data are the mean ± SEM of technical triplicates in one experiment. Data are representative of more than two independent experiments. *p < 0.05 and **p < 0.01 by one-way ANOVA with Tukey HSD test. Cells used in this figure are listed in Tables 2, 3.

Similar articles

Cited by

References

    1. Schildberg FA, Klein SR, Freeman GJ, Sharpe AH. Coinhibitory pathways in the B7-CD28 ligand-receptor family. Immunity. (2016) 44:955–72. 10.1016/j.immuni.2016.05.002 - DOI - PMC - PubMed
    1. Okazaki T, Chikuma S, Iwai Y, Fagarasan S, Honjo T. A rheostat for immune responses: the unique properties of PD-1 and their advantages for clinical application. Nat Immunol. (2013) 14:1212–8. 10.1038/ni.2762 - DOI - PubMed
    1. Esensten JH, Helou YA, Chopra G, Weiss A, Bluestone JA. CD28 Costimulation: from mechanism to therapy. Immunity. (2016) 44:973–88. 10.1016/j.immuni.2016.04.020 - DOI - PMC - PubMed
    1. Okazaki T, Honjo T. PD-1 and PD-1 ligands: from discovery to clinical application. Int Immunol. (2007) 19:813–24. 10.1093/intimm/dxm057 - DOI - PubMed
    1. Nishimura H, Okazaki T, Tanaka Y, Nakatani K, Hara M, Matsumori A, et al. . Autoimmune dilated cardiomyopathy in PD-1 receptor-deficient mice. Science. (2001) 291:319–22. 10.1126/science.291.5502.319 - DOI - PubMed

Publication types

MeSH terms

Substances