. 2019 Apr 2:10:667.
doi: 10.3389/fimmu.2019.00667. eCollection 2019.

NF-κB Signaling and IL-4 Signaling Regulate SATB1 Expression via Alternative Promoter Usage During Th2 Differentiation

Affiliations

NF-κB Signaling and IL-4 Signaling Regulate SATB1 Expression via Alternative Promoter Usage During Th2 Differentiation

Satyajeet P Khare et al. Front Immunol. .

Abstract

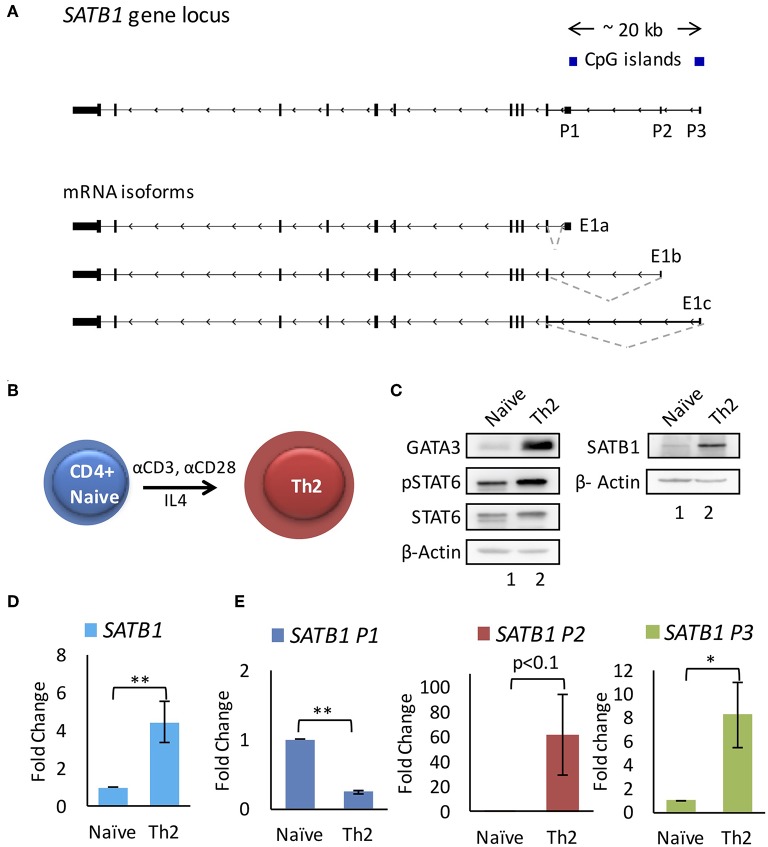
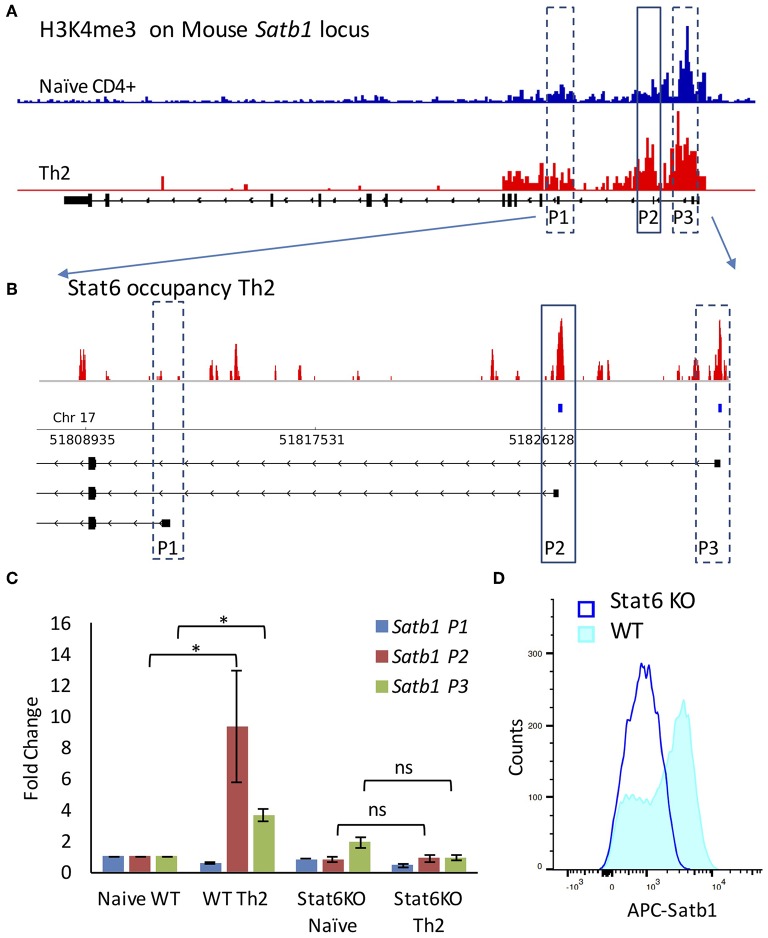
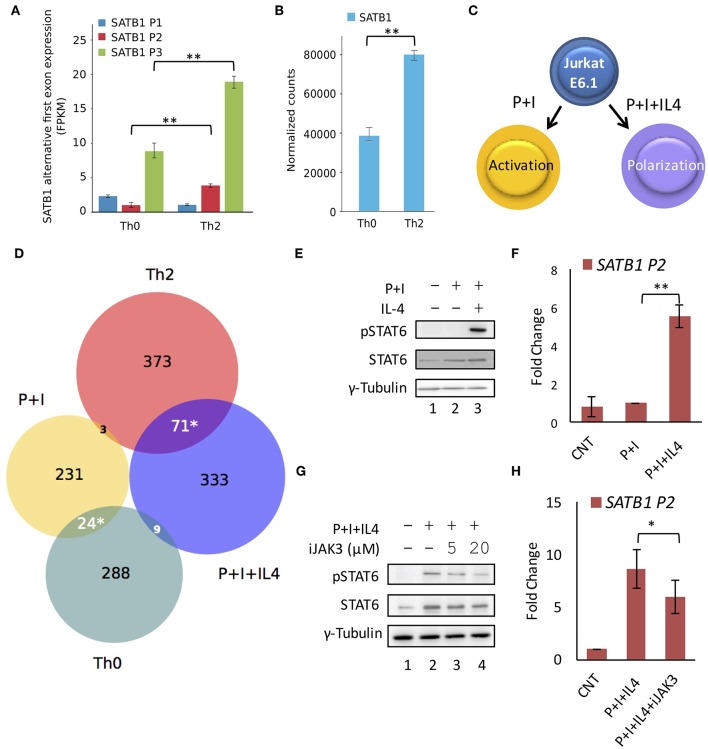
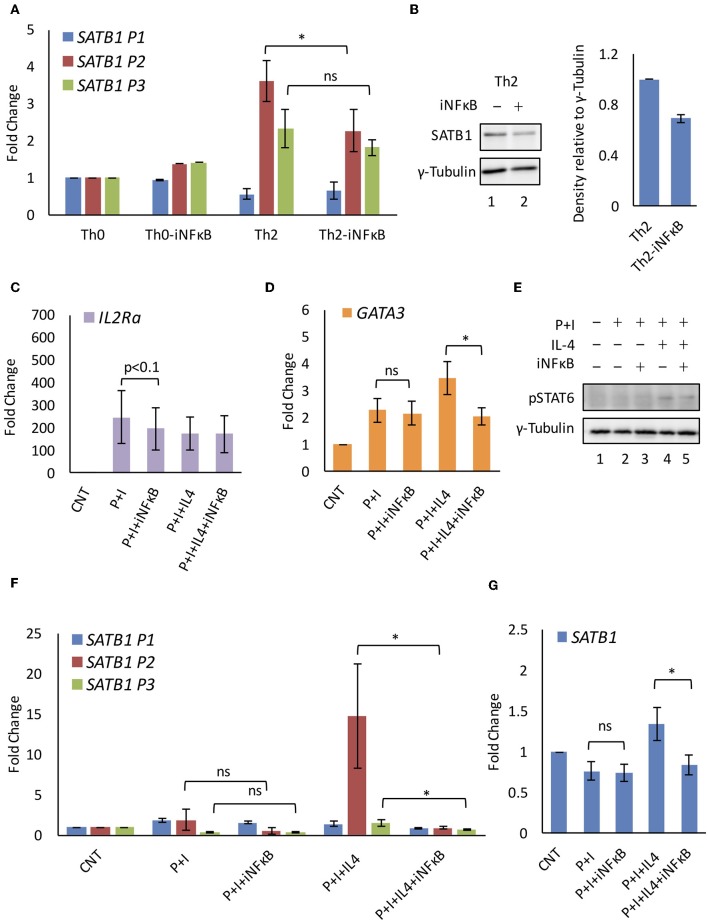
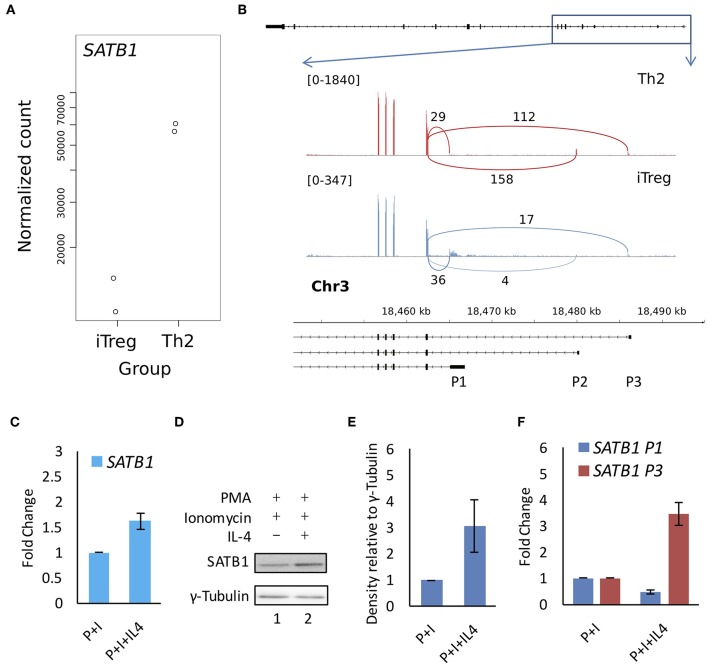
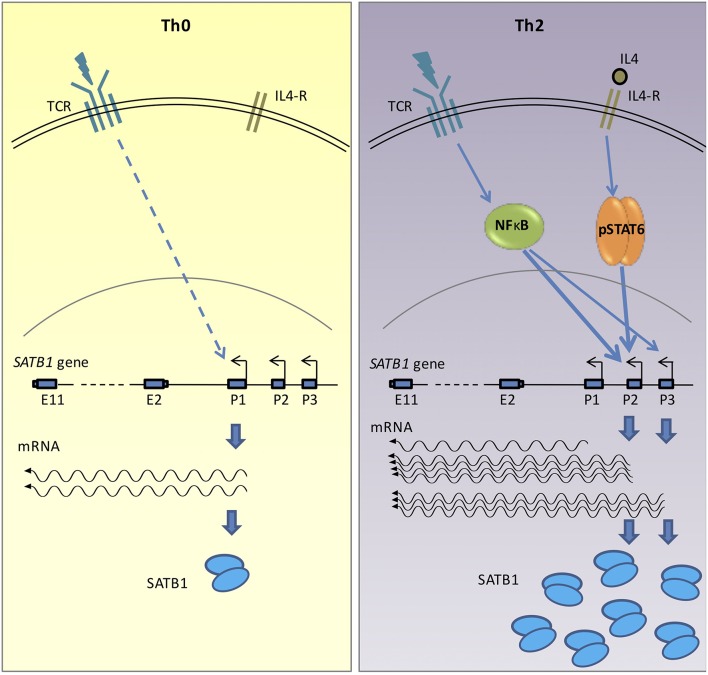
SATB1 is a genome organizer protein that is expressed in a lineage specific manner in CD4+ T-cells. SATB1 plays a crucial role in expression of multiple genes throughout the thymic development and peripheral differentiation of T cells. Although SATB1 function has been subjected to intense investigation, regulation of SATB1 gene expression remains poorly understood. Analysis of RNA-seq data revealed multiple transcription start sites at the upstream regulatory region of SATB1. We further demonstrated that SATB1 gene is expressed via alternative promoters during T-helper (Th) cell differentiation. The proximal promoter "P1" is used more by the naïve and activated CD4+ T-cells whereas the middle "P2" and the distal "P3" promoters are used at a significantly higher level by polarized T-helper cells. Cytokine and TCR signaling play crucial roles toward SATB1 alternative promoter usage. Under Th2 polarization conditions, transcription factor STAT6, which operates downstream of the cytokine signaling binds to the P2 and P3 promoters. Genetic perturbation by knockout and chemical inhibition of STAT6 activation resulted in the loss of P2 and P3 promoter activity. Moreover, chemical inhibition of activation of NF-κB, a transcription factor that operates downstream of the TCR signaling, also resulted in reduced P2 and P3 promoter usage. Furthermore, usage of the P1 promoter correlated with lower SATB1 protein expression whereas P2 and P3 promoter usage correlated with higher SATB1 protein expression. Thus, the promoter switch might play a crucial role in fine-tuning of SATB1 protein expression in a cell type specific manner.

Keywords: SATB1; STAT6; TCR signaling; alternative promoter; cytokine signaling.


Figures

Figure 1
Figure 1
SATB1 alternative promoter usage during T-helper 2 (Th2) cell differentiation. (A) SATB1 isoforms in CD4+ T-cells identified by RNA-Seq analysis. Three mRNA isoforms of SATB1 with alternative first exons (E1a, E1b, and E1c) that correspond to the usage of three alternative promoters (P1, P2, and P3, respectively). (B) Schematic of in vitro differentiation of naïve CD4+ T-cells into Th2 cells. Naive CD4+ cells were treated with anti-CD3 and anti-CD28 along with IL4 for 96 h to induce Th2 differentiation. (C) Immunoblot assay performed as mentioned in methods using the antibody against GATA3, phospho-STAT6 (pSTAT6), total STAT6 and SATB1 for naïve CD4+ and Th2 cells. Increase in expression of GATA3, pSTAT6, SATB1 confirms the differentiation of naive CD4+ cells into Th2 cells. (D,E) qRT-PCR analysis for total SATB1 expression and SATB1 alternative promoter usage in naive and differentiated Th2 cells. A significant increase in expression of SATB1 is observed which corresponds to increased usage of SATB1 P2 and P3 promoter. Error bars indicate SEM. (N = 6; * < 0.05, ** < 0.01); P-values were calculated using Student's t-test.
Figure 2
Figure 2
Stat6 regulates P2 promoter usage in vivo. (A) ChIP-Seq analysis of H3K4me3 levels on Satb1 locus in naive CD4+ and Th2 cells (mouse mm10 genome assembly) performed as mentioned in “Materials and methods”. H3K4me3 marks are enriched at the P2 and P3 promoter regions in Th2 cells as compared to naive CD4+ T-cells. (B) ChIP-Seq analysis of Stat6 occupancy at the Satb1 alternative promoters in Th2 cells (enlarged view of Satb1 regulatory region). Stat6 ChIP-Seq aligned reads (first track) and significant peaks (second track) along with Satb1 alternative promoters in mouse (mm10 genome assembly). Stat6 binds to the Satb1 P2 promoter in T-helper cells. (C) qRT-PCR analysis of Satb1 alternative promoter usage (P1, P2, and P3) in naive CD4+ and Th2 cells performed in WT and Stat6 KO mice, respectively. Error bars represent SEM (N = 4); P-values were calculated using one-way ANOVA (* < 0.05). Stat6 KO adversely affects Satb1 alternative promoter usage. Unlike the wild type animals, no significant increase is observed in Satb1 P2 and P3 promoter usage in cells from Stat6 KO animals subjected to Th2 differentiation conditions. (D) Flow cytometry analysis for Satb1 protein expression in wild-type and Stat6 KO, respectively under Th2 differentiating conditions. Satb1 protein expression is not enhanced when naive T-cells from Stat6 KO animals are subjected to Th2 differentiation conditions.
Figure 3
Figure 3
STAT6 regulates P2 promoter usage in vitro. RNA-Seq analysis of available data (GSE71645) for (A) expression of SATB1 alternative first exons and (B) total SATB1 expression. Expression analysis confirms higher usage of SATB1 P2 and P3 promoters and higher total SATB1 expression in human Th2 cells as compared to Th0 cells. Error bars represent min-max values of FPKM and normalized counts, respectively (N = 3); P-values calculated using EdgeR and DESeq2 respectively. (C) Schematic for the treatment of Jurkat cells under activating (PMA+Ionomycin; P+I) and polarizing conditions (+IL4). (D) Venn diagram showing an overlap of differentially expressed genes obtained by RNA-seq analysis between Th0 vs. Th2 cells and P+I vs. P+I+IL4 treated Jurkat cells. Significant overlap is observed between genes expressed higher in Th2 and P+I+IL4 treated Jurkat cells suggesting that Jurkat cell line-based model mimics Th2 differentiation condition. Significance of overlap was calculated using two-tailed hypergeometric test. (E) Immunoblot analysis confirms STAT6 activation (pSTAT6) only in Jurkat cells subjected to polarizing conditions. γ-Tubulin was used as loading control. (F) qRT-PCR analysis for SATB1 P2 promoter usage in Jurkat cells activated with TCR and cytokine signaling. A significant increase in expression is observed in SATB1 P2 promoter usage in Jurkat cells under polarization conditions (N = 5). (G) Immunoblot analysis for pSTAT6 levels and (H) qRT-PCR analysis for SATB1 P2 promoter usage in Jurkat cells activated with TCR and cytokine signaling in presence of JAK3 inhibitor. A decrease in pSTAT6 levels and SATB1 P2 promoter usage is observed upon JAK3 inhibition. Error bar represents SEM (N = 3); P-values calculated using Student's t-test (* < 0.05, ** < 0.01).
Figure 4
Figure 4
NF-κB regulates SATB1 P2 promoter expression. (A) Quantitative RT-PCR analysis of SATB1 alternative promoter usage in iNF-κB treated Th0 and Th2 cells. (B) Western blot for SATB1 expression in control and iNF-κB treated Th2 cells and densitometry analysis of expression (N = 4). Quantitative RT-PCR analysis of NF-κB target genes (C) IL2Ra and (D) GATA3 confirms NF-κB inhibition in Jurkat cells subjected to activating and polarizing conditions. (E) Immunoblot analysis of activated STAT6 (pSTAT6) expression. Quantitative RT-PCR analysis of (F) SATB1 alternative promoter usage and (G) total SATB1 expression upon NF-κB inhibition in Jurkat cells. A significant decrease in SATB1 P2 and P3 promoter usage was observed upon inhibition of NF-κB in polarized but not in activated Jurkat cells (N = 5). Error bar represents SEM and P-value calculated using one-way ANOVA (ns, not significant) (* < 0.05).
Figure 5
Figure 5
SATB1 alternative promoter usage in Treg and Th2 cells and correlation with protein expression. Available RNA-seq data (E-MTAB-2319) was analyzed for (A) total SATB1 expression and (B) for junction reads at the SATB1 locus in Th2 and iTreg cells. Total SATB1 expression is lower but P1 promoter usage is higher in iTreg cells as compared to Th2 cells. (C) Quantitative RT-PCR, (D) immunoblot, and (E) densitometry analysis for SATB1 expression in Jurkat cells subjected to activating and polarizing conditions. (F) Quantitative RT-PCR analysis for SATB1 promoter suggests that the P1 promoter usage showed weak correlation with SATB1 protein expression. Error bar represents SEM (N = 3 for Figures 3C,E,F).
Figure 6
Figure 6
Graphical representation of SATB1 expression via alternative promoters in activated (Th0) and polarized (Th2) CD4+ T-cells. Activation of non-specific TCR signaling in Th0 cells leads to SATB1 P1 promoter usage. However, in the polarized Th2 cells, activation of cytokine signaling along with TCR activation leads to use of P2 and P3 promoters. Transcription factor STAT6, which acts downstream of the cytokine signaling and NF-κB, which acts downstream of the TCR signaling, positively regulate P2 and P3 promoter usage in polarizing conditions. The switch in promoter usage also correlates with change in SATB1 protein expression. The promoter switch may therefore enable regulation of SATB1 expression in a cell-type specific manner.

Similar articles

Cited by

References

    1. Hosokawa H, Rothenberg EV. Cytokines, transcription factors, and the initiation of T-cell development. Cold Spring Harb Perspect Biol. (2018) 10:a028621. 10.1101/cshperspect.a028621 - DOI - PMC - PubMed
    1. Hoefig KP, Heissmeyer V. Posttranscriptional regulation of T helper cell fate decisions. J Cell Biol. (2018) 217:2615–31. 10.1083/jcb.201708075 - DOI - PMC - PubMed
    1. Zhu J, Paul WE. Peripheral CD4+ T-cell differentiation regulated by networks of cytokines and transcription factors. Immunol Rev. (2010) 238:247–62. 10.1111/j.1600-065X.2010.00951.x - DOI - PMC - PubMed
    1. Dickinson LA, Joh T, Kohwi Y, Kohwi-Shigematsu T. A tissue-specific MAR/SAR DNA-binding protein with unusual binding site recognition. Cell. (1992) 70:631–45. 10.1016/0092-8674(92)90432-C - DOI - PubMed
    1. Burute M, Gottimukkala K, Galande S. Chromatin organizer SATB1 is an important determinant of T-cell differentiation. Immunol Cell Biol. (2012) 90:852–9. 10.1038/icb.2012.28 - DOI - PubMed

Publication types

MeSH terms