

Review
doi: 10.1080/14686996.2018.1530938.
eCollection 2018.
Thermoelectric materials and applications for energy harvesting power generation
Affiliations
- PMID: 31001364
- PMCID: PMC6454408
- DOI: 10.1080/14686996.2018.1530938
Item in Clipboard
Review
Thermoelectric materials and applications for energy harvesting power generation
Sci Technol Adv Mater.
.
Abstract
Thermoelectrics, in particular solid-state conversion of heat to electricity, is expected to be a key energy harvesting technology to power ubiquitous sensors and wearable devices in the future. A comprehensive review is given on the principles and advances in the development of thermoelectric materials suitable for energy harvesting power generation, ranging from organic and hybrid organic-inorganic to inorganic materials. Examples of design and applications are also presented.
Keywords: 210 Thermoelectronics / Thermal transport / insulators; 50 Energy Materials; Thermoelectric; energy harvesting; organic; thin film.
Figures
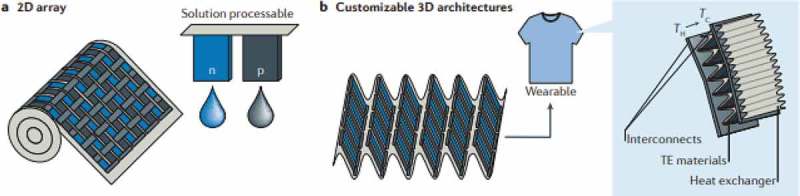
(a) A printed polymer thermoelectric device from a roll-to-roll process from solution processable p-type and n-type polymers. (b) 2D printed arrays can be folded into flexible and lightweight 3D structures ideal for wearable applications. Reprinted by permission from Springer [11], Nature Materials Reviews, Copyright 2016.
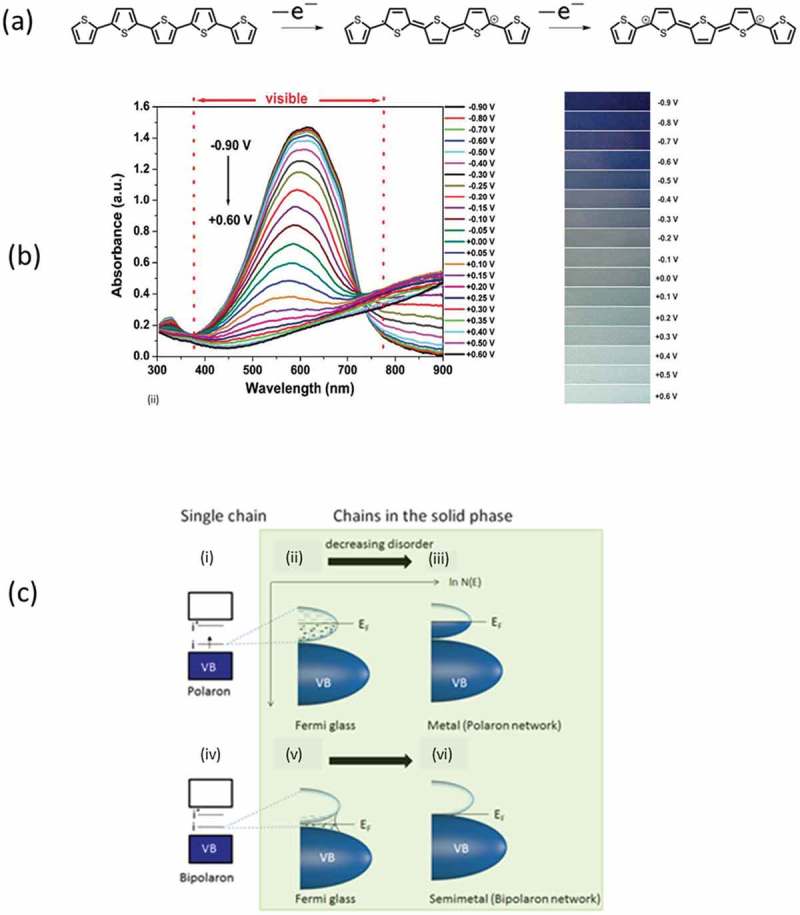
(a) The oxidation of an oligothiophene that forms a polaron (center) and a bipolaron (right). Reproduced from [17] with permission of The Royal Society of Chemistry. (b) UV-Vis spectra (left) and the respective color change (right) in PEDOT, where the doping levels are electrochemically tuned. Reproduced from [18] with permission of The Royal Society of Chemistry. (c) The dependence of the density of states of the conducting polymers to the order of the system. As disorder decreases, the system changes from a fermi glass to a metal (for a network of polarons i.e. Polyaniline) or from a fermi glass to a Semimetal (for a bipolaron network). Reprinted by permission from Springer: Nature Materials, [21], Copyright 2014.
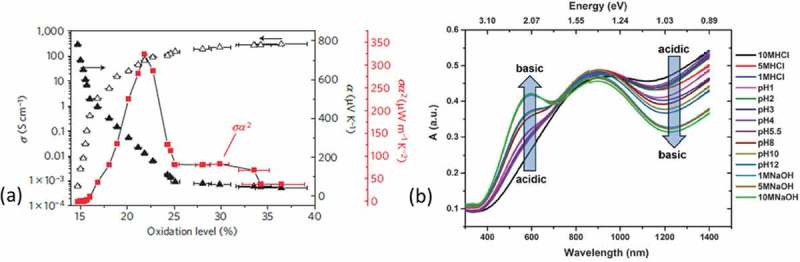
(a) The electrical conductivity, σ, the Seebeck coefficient, α, and the power factor, σα2, versus the oxidation levels of the PEDOT:Tos films. Reprinted by permission from Springer: Nature Materials [26], Copyright 2011. (b) The UV-Vis spectra of acid and base treated PEDOT:Tos with respect the pH of the treating solution [29]. Published by The Royal Society of Chemistry.
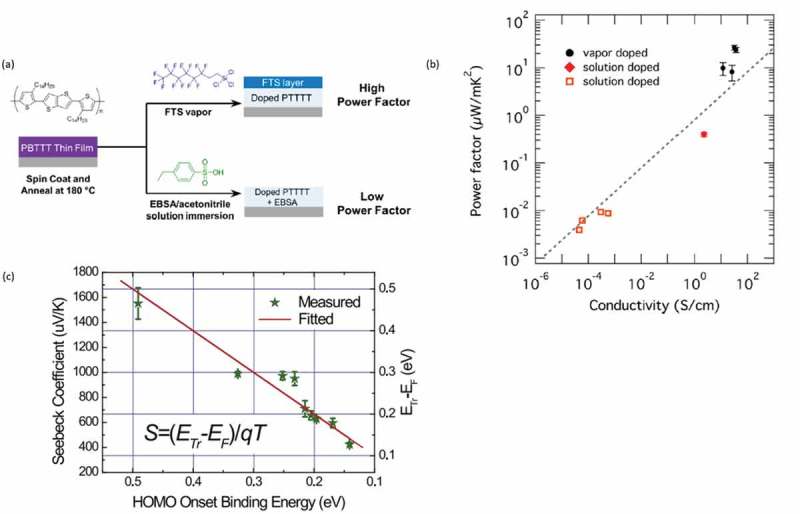
(a) The vapor and solution routes for the treatment of PBTTT. Reprinted (adapted) with permission from [32]. Copyright (2016) American Chemical Society. (b) The power factor vs conductivity for P3HT treated with vapors and solutions. Reprinted (adapted) with permission from [33]. Copyright (2018) American Chemical Society. (c) The Seebeck coefficient vs the HOMO Onset Binding Energy for the F4-TCNQ treated P3HT. The linear fit corresponds to the mobility edge model. Reprinted from [34], Copyright (2018), with permission from Elsevier.
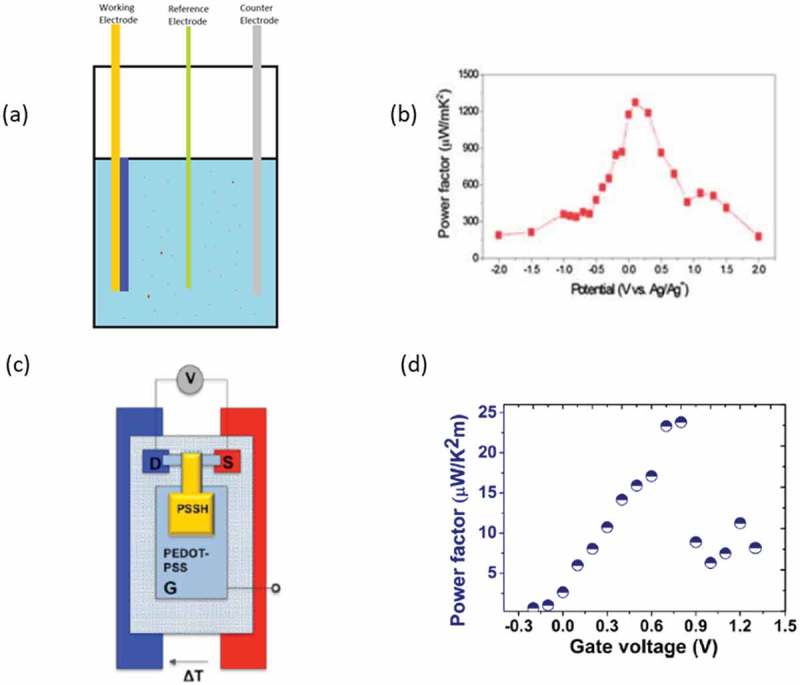
(a) A conventional electrochemical setup; with yellow is the working electrode that has the PEDOT (blue) deposited on top, with green is the reference electrode (usually Ag/AgCl) and with gray is the counter electrode. (b) The power factor of PEDOT:Tos films plotted against the applied voltage from chronocoulometry. Reproduced from [35] with permission of The Royal Society of Chemistry. (c) Organic electrochemical transistor used for the optimization of the thermoelectric properties of PEDOT:PSS and the resulting power factor (d) plotted versus the applied gate voltage. Reprinted with permission from [36]. Copyright 2012 American Chemical Society.
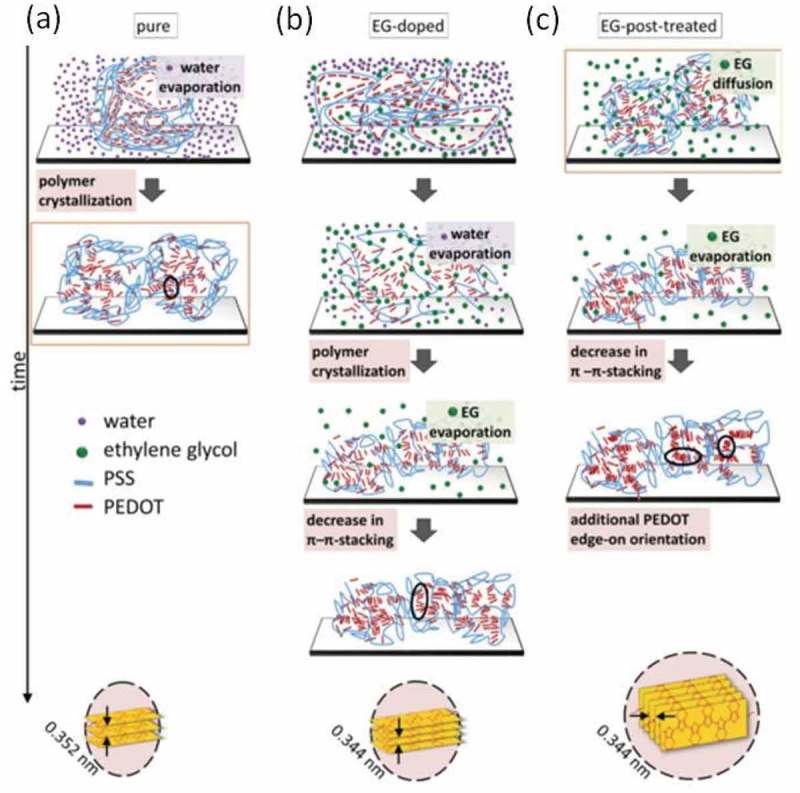
The effect of plasticizing agents like EG on the PEDOT:PSS structure. When EG is added to the PEDOT:PSS material (b), the crystallization process is slowed down resulting in better stacked chains, in comparison to the pure (a) material. When the thin films are further treated with an EG bath, the system recrystallizes and shift from an face-on to an edge-on configuration. Reprinted by permission from Wiley [51], Copyright 2015.
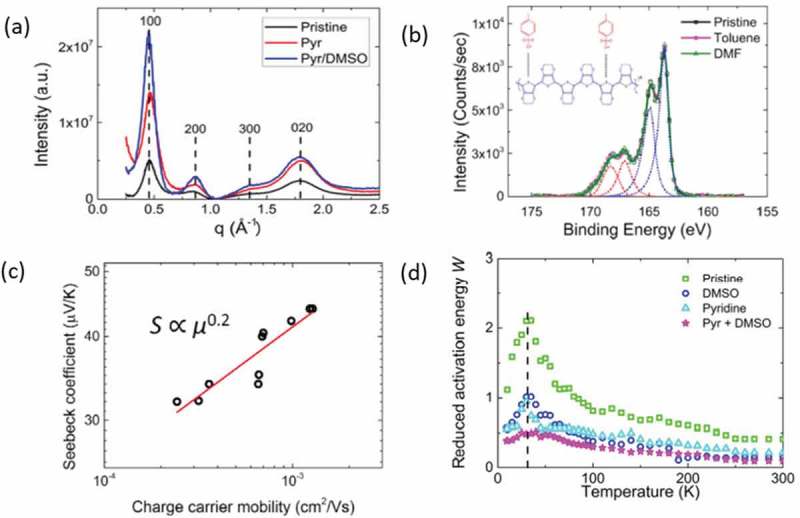
(a) The radially averaged intensity versus the scattering vector q for the various PEDOT:Tos samples. A higher intensity in the peak corresponding to the (100) reflection is respective to a system of higher degree of crystallinity. (b) the XPS spectra of PEDOT:Tos samples with various solvent additives, (c) the extracted relationship between Seebeck coefficient and charge carrier mobility with constant oxidation levels and (d) the Reduced activation energy W versus Temperature, where the Mott transitions are observed. Crystallinity and charge carrier mobility are increasing from the Pristine to the Pyr+ DMSO samples. A negative slope of W is represents a semiconducting material, while constant W is respective of a semimetal [22,46]. Reprinted from Organic Electronics [22]. Copyright 2018, with permission from Elsevier.
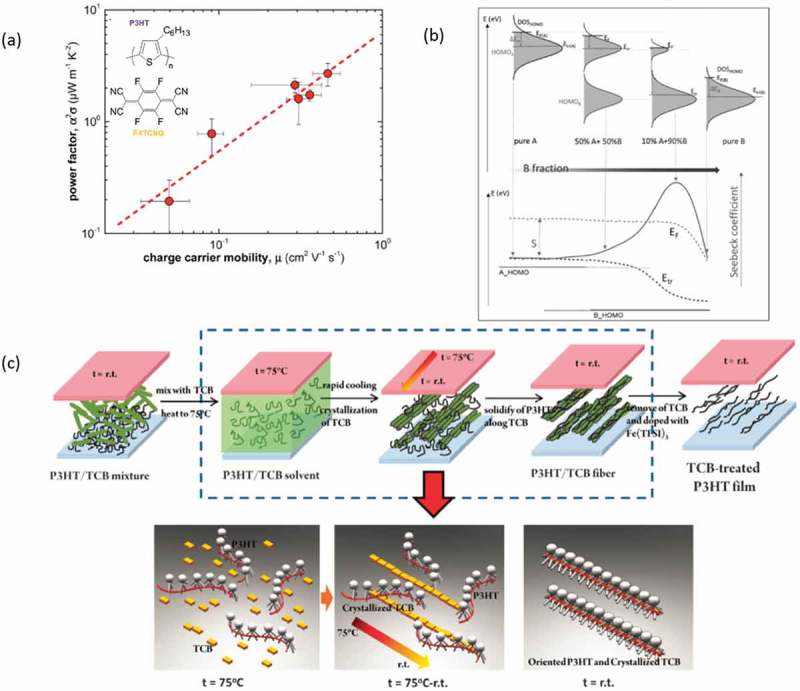
(a) The vapor treatment reported by Hynynen et al. [59] (left) and the extracted power factor/charge carrier mobility (right) for their systems [59]. Published by The Royal Society of Chemistry. (b) The modification of the density of states with the fraction of the polymers in the mixture. Reprinted by permission from Wiley [62], Copyright 2018. (c) The process reported by Qu et al. [60] in using TCB in order to enhance the ordering and thermoelectric properties of P3HT.
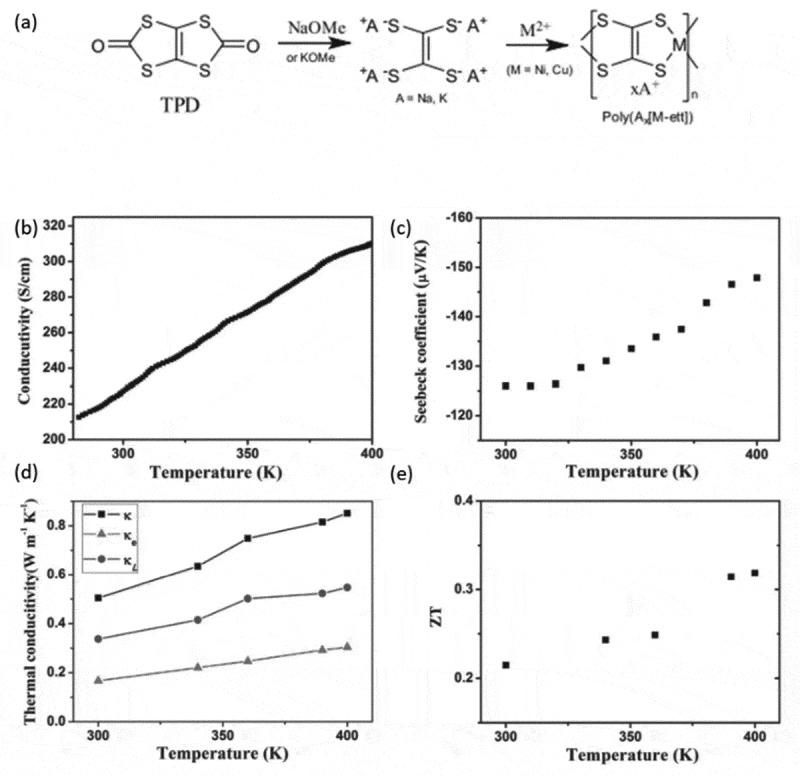
(a) The synthetic route for the metal coordination polymers that Sun et al. reported. Reprinted by permission from Wiley [65], Copyright 2012. (b-e) the electrical conductivity, Seebeck coefficient, thermal conductivity and figure of merit plotted against the temperature for the electropolymerized poly(Ni-ett). Reprinted by permission from Wiley [67]. Copyright 2016.
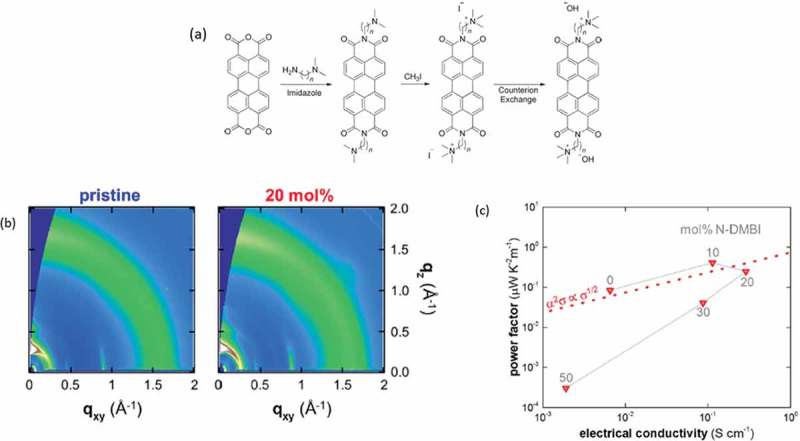
(a) The naphthalene derivatives reported by Russ et al. Reprinted by permission from Wiley [70] Copyright 2014. (b) The GIWAXS patterns for the pristine and doped napthalenediimide derivatives. A higher degree of crystallinity is observed for the doped ones. (c) the power factor vs the electrical conductivity for those systems. Reprinted (adapted) with permission from [73]. Copyright 2018 American Chemical Society.
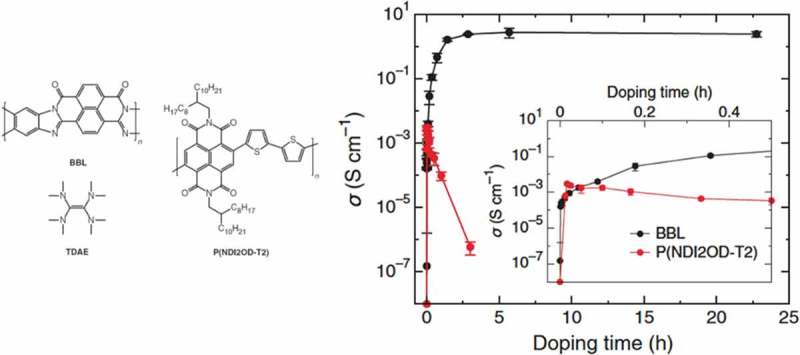
(left) The BBL, P(NDI2OD-T2) and TDAE structures, (right) the tuning of the electrical conductivity of such systems with doping time. Reprinted by permission from Wiley [74] Copyright 2017.
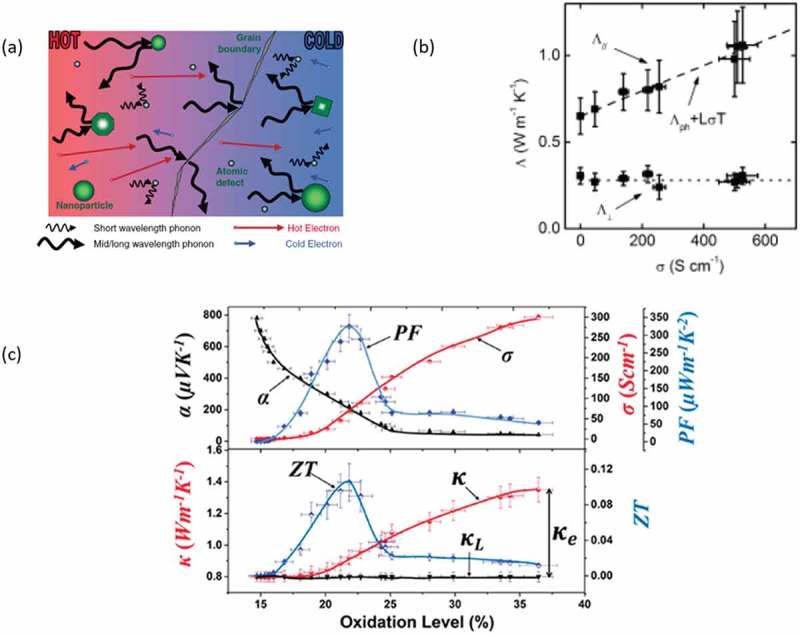
(a) A schematic description of the electron-crystal/phonon glass concept. Reprinted by permission from Wiley [76] Copyright 2010. (b) The behavior between the thermal conductivity in the in-plane and out-of-plane direction (noted here as Λ), and the electrical conductivity for PEDOT:PSS, as reported by Liu et al. [79]. The dashed line represents the Wiedemann–Franz law. Reprinted with permission from [79], Copyright 2015 American Chemical Society. (c) All the parameters necessary for the thermoelectric optimization, plotted vs the Oxidation levels for PEDOT. Reprinted by permission from Wiley [77], Copyright 2016.
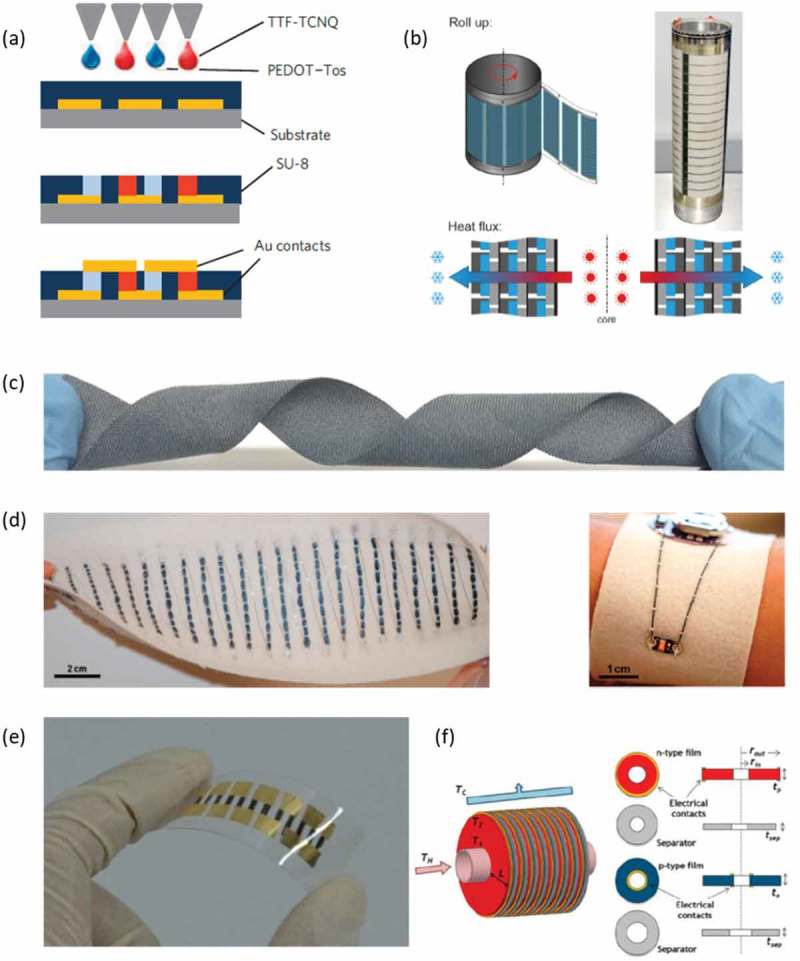
(a) The polymer thermogenerator with bulk compartments reported by Bubnova et al. [26] Reprinted by permission from Springer: Nature Materials [26], Copyright 2011. (b) Top: The thermoelectric device fabricated with the roll-to-roll process. Bottom: The heat transport for the functionality of the thermoelectric device. Reprinted by permission from [84] Wiley. Copyright 2013. (c) The polyester fabric coated with PEDOT:PSS reported by Du et al. [92]. Reprinted by permission from Springer: Scientific Reports [92]. Copyright 2015. (d) (left) The 26 p-type legs thermoelectric device with the yarn; (right) image of an LED connected with PEDOT:PSS dyed silk yarns to a battery (embroidered on felted wool fabric). Reprinted (adapted) with permission from [93]. Copyright 2017 American Chemical Society. (e) The ink-jet printed device with the metal coordination polymer, reported by Jiao et al. [95]. Republished with permission of Royal Society, from [95]; permission conveyed through Copyright Clearance Center, Inc. (f) Illustration of the radial thermoelectric generator. Reprinted (adapted) with permission from [90]. Copyright 2016 American Chemical Society.
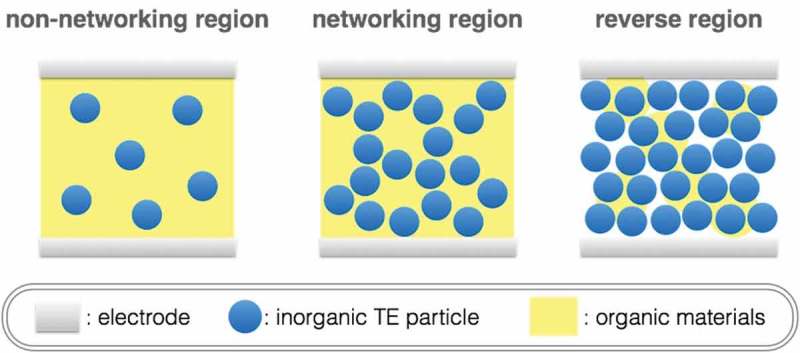
Schematic image of organic–inorganic hybrid TE materials depending on the volume ratio.
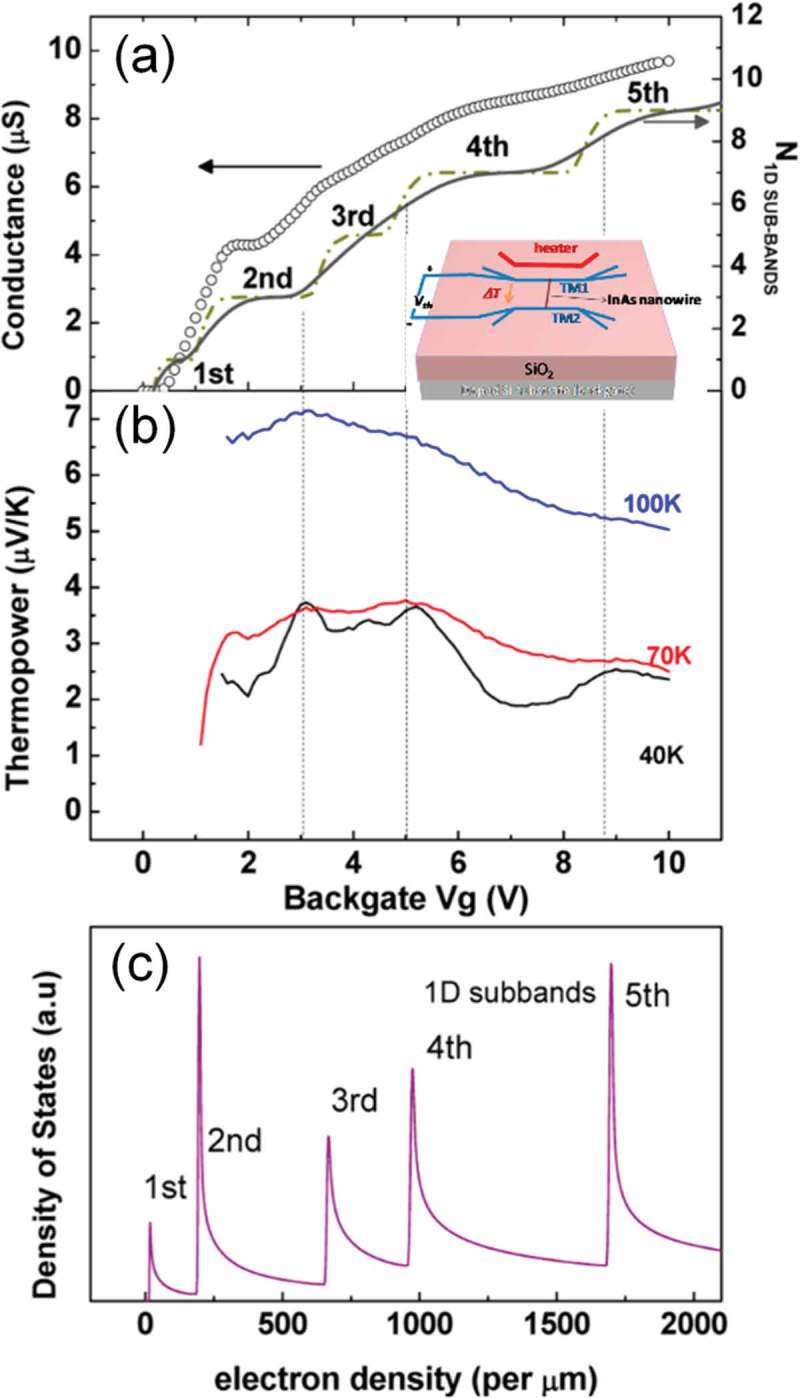
Gate-tuned conductance and thermopower of InAs nanowire. (a) Comparing the measured conductance (40 K) vs gate voltage (Vg) data (open circle) with the calculated one dimensional (1D) subband occupation with only thermal broadening (dash dotted line) or both the thermal and the scattering broadening (solid line) considered. (b) Gate modulation of thermopower (S) at 100, 70, and 40 K. The dashed vertical lines are a guide to the eye, highlighting the appearance of peak in S(Vg) when a 1D subband starts to be filled. (c) Calculated density of states vs 1D electron density in nanowire with the index of subbands marked. Reproduced with permissions from [135].
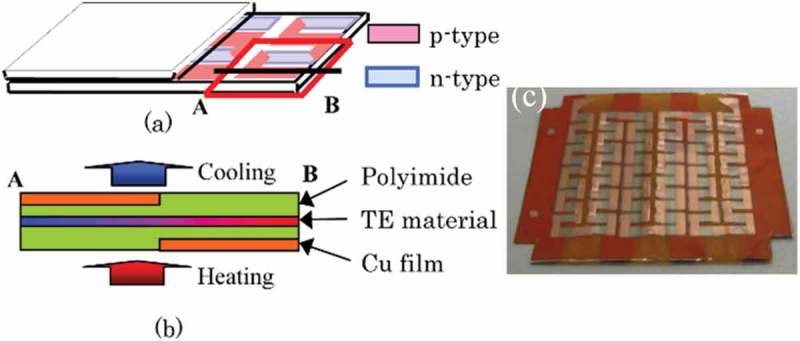
Schematic illustrations (a) (b) and picture (c) of the flexible thermoelectric (TE) device developed by Takeda et al. The flexible thermoelectric device consists of 33 pairs of p-n couples composed of chromel and constantan layers within approximately 30 mm × 30 mm. Reproduced with permissions from [140] and [141].
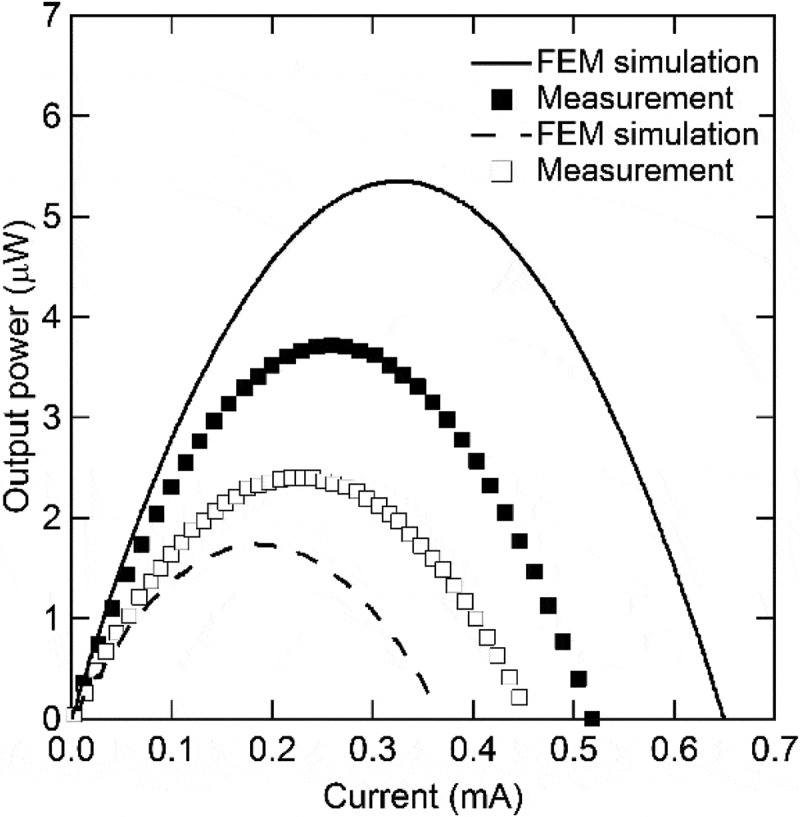
Current–output power characteristics of two different flexible thermoelectric devices reported by Takeda et al. Reproduced with permission from [141].
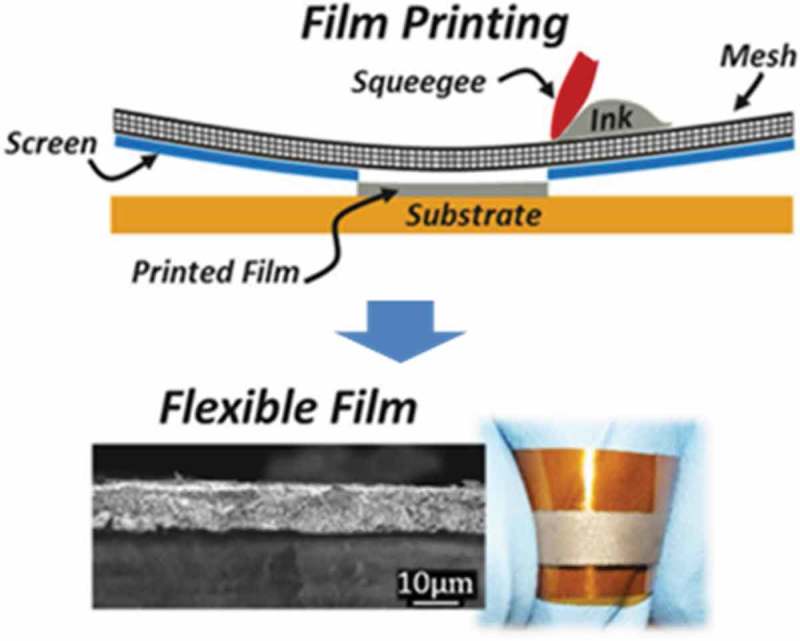
Schematic illustrations of the preparation of flexible film using screen-printing technique reported by Varghese et al. Reproduced with permissions from Ref. [142].
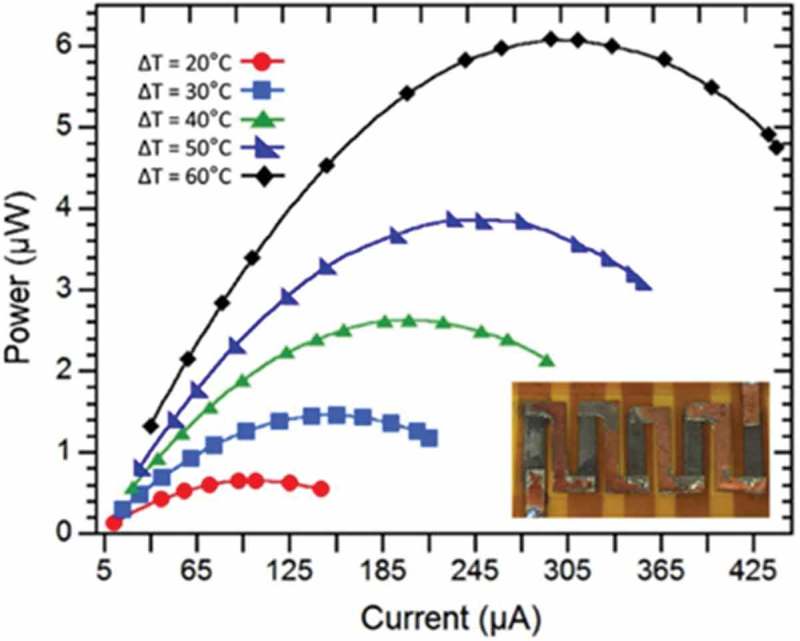
Current–output power characteristics of flexible thermoelectric devices prepared using screen-printed Bi2Te2.8Se0.2 film. Inset is a picture of the devices. Reproduced with permissions from [142].
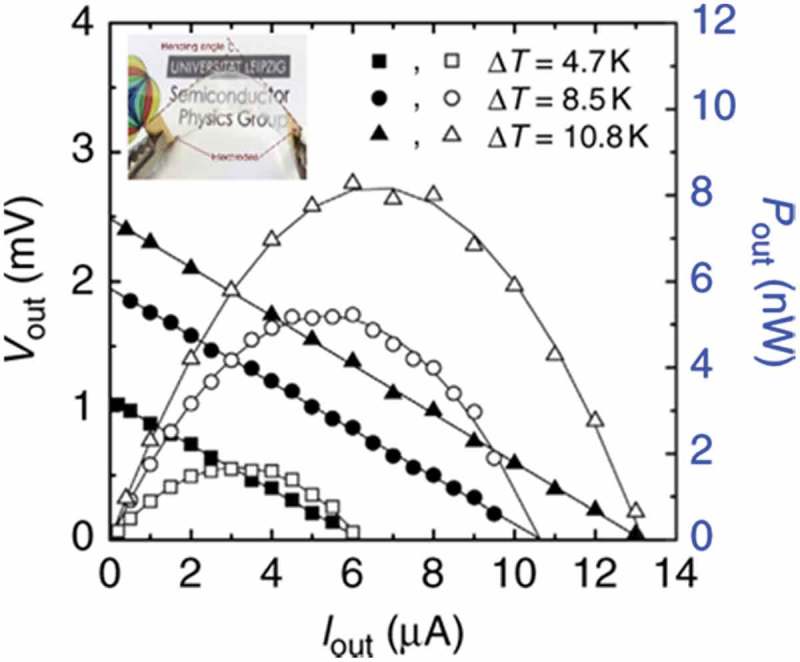
Output voltage (Vout) and output power (Pout) of a γ-CuI-based flexible thermoelectric device. Inset is a picture of the transparent γ-CuI film on flexible PET substrate. Reproduced with permissions from [143].
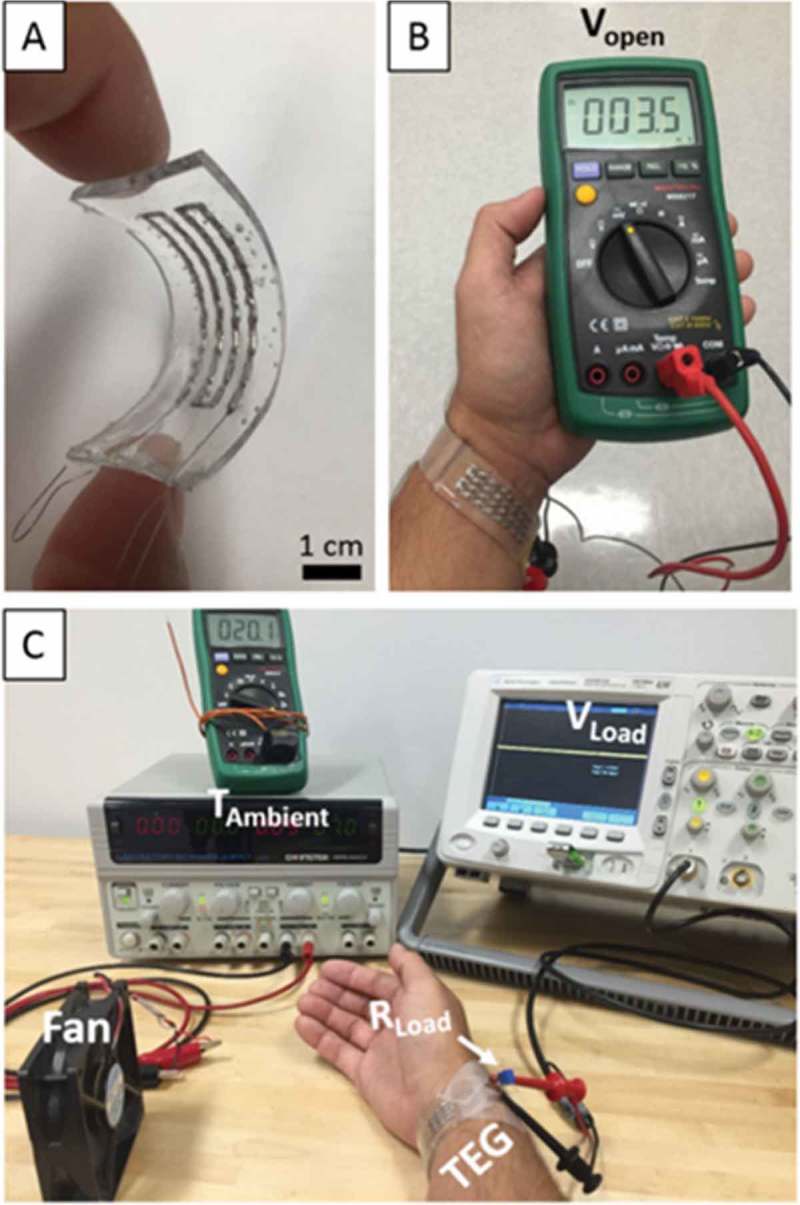
Thermoelectric generation using flexible thermoelectric devices from the human body reported by Suarez et al. (A) Flexible thermoelectric device test, (B) open circuit voltage at room temperature, and (C) test setup for thermoelectric device performance. Reprinted with permissions from [145].
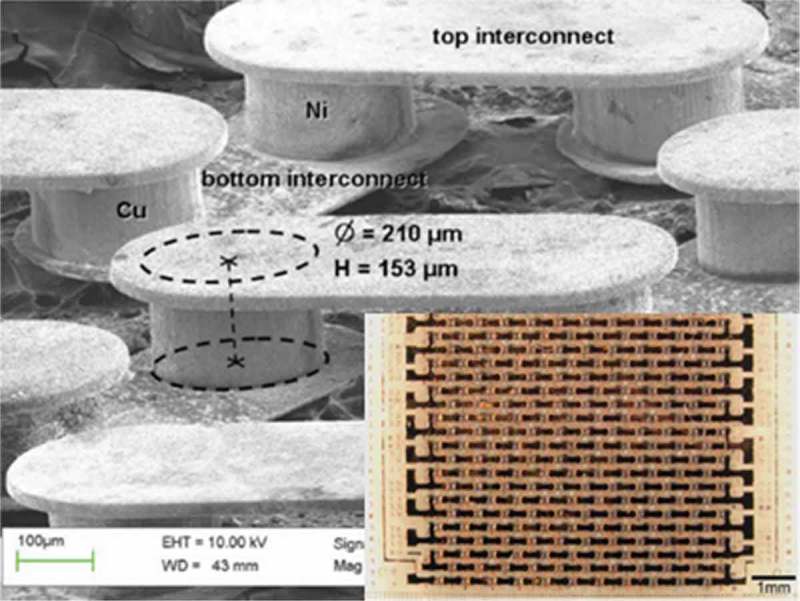
Scanning electron microscope (SEM) image of micro-thermoelectric generator composed of Ni-Cu-based thermocouples reported by Glatz et al. Inset is a picture of a micro-thermoelectric generator with 253 thermocouples. The leg diameter is 210 µm, and the thickness is 140 µm. Reprinted with permission from [148].
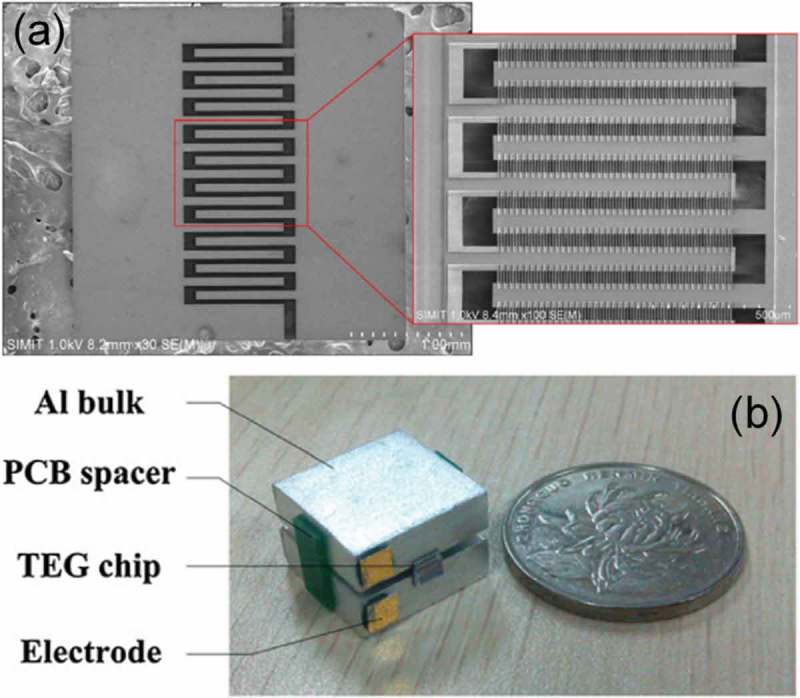
CMOS MEMS-based micro-thermoelectric generator composed of n- and p-type poly-Si reported by Yu et al. (a) SEM photograph of micro-thermoelectric generators and (b) picture of a test module. Reprinted with permission from [149].
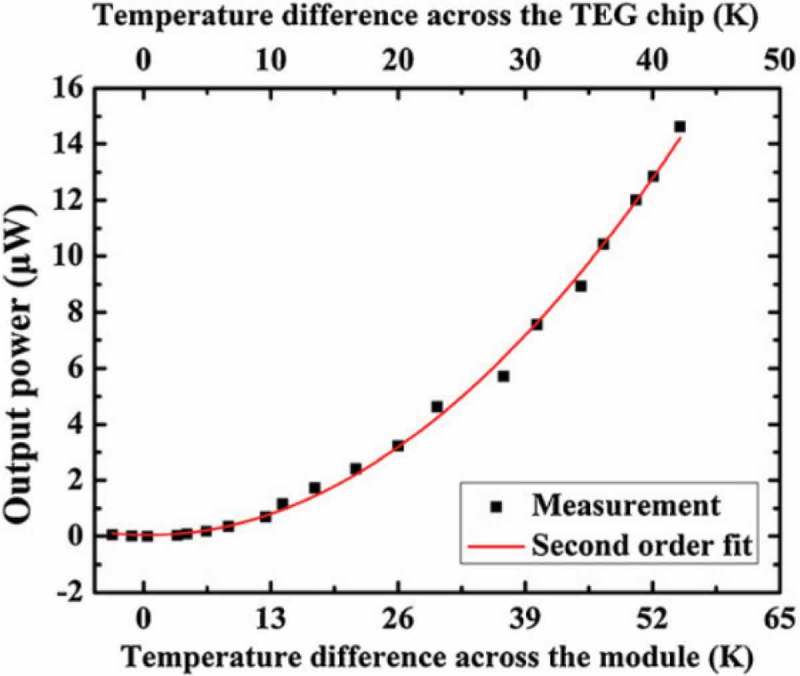
Output power versus temperature difference across the CMOS MEMS-based micro-thermoelectric generator module reported by Yu et al. Reprinted with permission from [149].
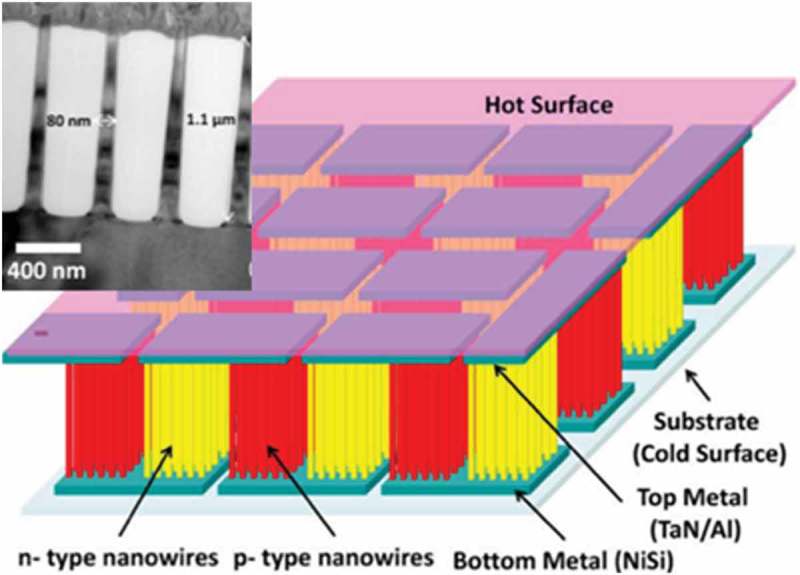
Schematic illustration and SEM image of Si nanowire micro-thermoelectric generators reported by Li et al. Reprinted with permission from [151].
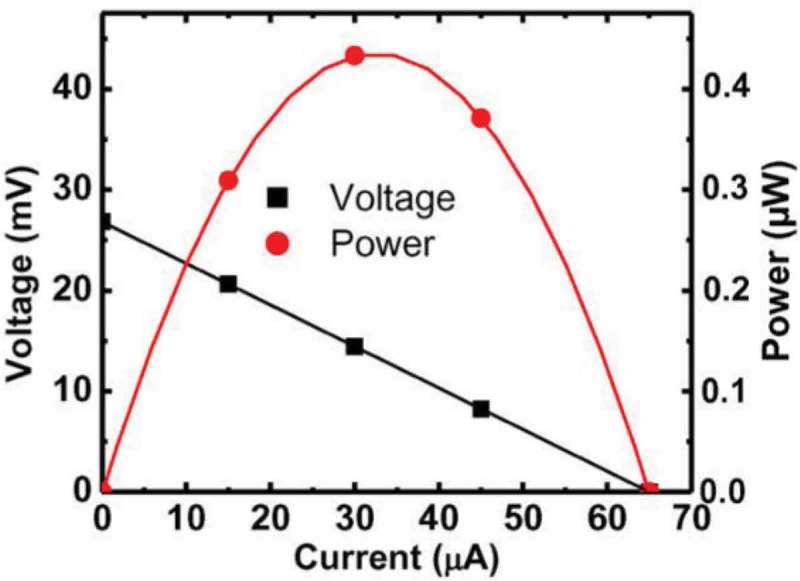
Output voltage and output power of a Si nanowire micro-thermoelectric genreators reported by Li et al. Reproduced with permission from [151].
References
-
- Bryzek J, Grace RH.. Trillion sensor initiative. Commer Micro Manuf. 2014;7:42–46.
-
- Mori T, Priya S. Materials for energy harvesting: at the forefront of a new wave. MRS Bull. 2018;43(3):176–180.
-
- Rowe DM. Thermoelectrics handbook: macro to nano. Boca Raton (FL): CRC Press, Taylor & Francis Group; 2006.
-
- Liu W, Kim HS, Jie Q, et al. Importance of high power factor in thermoelectric materials for power generation application: A perspective. Scr Mater. 2016;111:3–9.
-
- Mori T. Novel principles and nanostructuring methods for enhanced thermoelectrics. Small. 2017;17:1702013. - PubMed
Publication types
LinkOut - more resources
Full Text Sources
Other Literature Sources