Effects of Oxygen Concentration and Culture Time on Porcine Nucleus Pulposus Cell Metabolism: An in vitro Study
- PMID: 31001527
- PMCID: PMC6454860
- DOI: 10.3389/fbioe.2019.00064
Effects of Oxygen Concentration and Culture Time on Porcine Nucleus Pulposus Cell Metabolism: An in vitro Study
Abstract
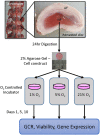
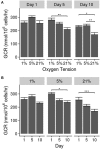
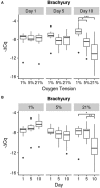
Low back pain is a common ailment that affects millions of individuals each year and is linked to degeneration of the intervertebral discs in the spine. Intervertebral disc degeneration is known to result from an imbalance in anabolic and catabolic activity by disc cells. Due to the avascular nature of the intervertebral disc, oxygen deficiency may occur in the central nucleus pulposus (NP). The resulting hypoxia affects matrix regulation and energy metabolism of disc cells, although the mechanisms are not fully understood. This study investigates in vitro glucose consumption and gene expression by NP cells over time under varying oxygen tensions. Notochordal porcine NP cells were cultured in agarose discs at 21, 5, or 1% oxygen tension for 1, 5, or 10 days. The expression of 10 key matrix genes, as well as Brachyury (T), by NP cells was analyzed using RT-PCR. Glucose consumption was measured using a two-point method. Results show that culture time and oxygen tension significantly affect glucose consumption rates by porcine NP cells. There were also significant changes in T expression based on oxygen level and culture time. The 1% oxygen tension had a significantly higher T expression on day 10 than the other two groups, which may indicate a better maintenance of the notochordal phenotype. MMP 1 and 13 expression increased over time for all groups, while only the 5% group showed an increase over time for MMP 3. TIMP expression followed the direction of MMPs but to a lesser magnitude. Five percent and twenty-one percent oxygen tensions led to decreases in anabolic gene expression while 1% led to increases. Oxygen concentration and culture time significantly impacted glucose consumption rate and the gene expression of matrix regulatory genes with hypoxic conditions most accurately maintaining the proper NP phenotype. This information is valuable not only for understanding disc pathophysiology, but also for harnessing the potential of notochordal NP cells in therapeutic applications.
Keywords: brachyury; consumption rate; gene expression; intervertebral disc; notochordal.
Figures


Similar articles
-
Native nucleus pulposus tissue matrix promotes notochordal differentiation of human induced pluripotent stem cells with potential for treating intervertebral disc degeneration.J Biomed Mater Res A. 2015 Mar;103(3):1053-9. doi: 10.1002/jbm.a.35243. Epub 2014 Jun 17. J Biomed Mater Res A. 2015. PMID: 24889905
-
Nonviral Transfection With Brachyury Reprograms Human Intervertebral Disc Cells to a Pro-Anabolic Anti-Catabolic/Inflammatory Phenotype: A Proof of Concept Study.J Orthop Res. 2019 Nov;37(11):2389-2400. doi: 10.1002/jor.24408. Epub 2019 Jul 29. J Orthop Res. 2019. PMID: 31286562
-
Effect of hyperglycemia on apoptosis of notochordal cells and intervertebral disc degeneration in diabetic rats.J Neurosurg Spine. 2009 Dec;11(6):741-8. doi: 10.3171/2009.6.SPINE09198. J Neurosurg Spine. 2009. PMID: 19951028
-
Differential phenotypic behaviors of human degenerative nucleus pulposus cells under normoxic and hypoxic conditions: influence of oxygen concentration during isolation, expansion, and cultivation.Spine J. 2013 Nov;13(11):1590-6. doi: 10.1016/j.spinee.2013.05.025. Epub 2013 Jun 22. Spine J. 2013. PMID: 23800820
-
Defects in intervertebral disc and spine during development, degeneration, and pain: New research directions for disc regeneration and therapy.Wiley Interdiscip Rev Dev Biol. 2019 Jul;8(4):e343. doi: 10.1002/wdev.343. Epub 2019 Apr 11. Wiley Interdiscip Rev Dev Biol. 2019. PMID: 30977275 Free PMC article. Review.
Cited by
-
Injectable Cell-Laden Nanofibrous Matrix for Treating Annulus Fibrosus Defects in Porcine Model: An Organ Culture Study.Life (Basel). 2022 Nov 12;12(11):1866. doi: 10.3390/life12111866. Life (Basel). 2022. PMID: 36431001 Free PMC article.
-
Preclinical to clinical translation for intervertebral disc repair: Effects of species-specific scale, metabolism, and matrix synthesis rates on cell-based regeneration.JOR Spine. 2023 Sep 7;6(3):e1279. doi: 10.1002/jsp2.1279. eCollection 2023 Sep. JOR Spine. 2023. PMID: 37780829 Free PMC article.
-
Silencing circATXN1 in Aging Nucleus Pulposus Cell Alleviates Intervertebral Disc Degeneration via Correcting Progerin Mislocalization.Research (Wash D C). 2024 Mar 23;7:0336. doi: 10.34133/research.0336. eCollection 2024. Research (Wash D C). 2024. PMID: 38533181 Free PMC article.
-
Development of 2-D and 3-D culture platforms derived from decellularized nucleus pulposus.Front Bioeng Biotechnol. 2022 Sep 27;10:937239. doi: 10.3389/fbioe.2022.937239. eCollection 2022. Front Bioeng Biotechnol. 2022. PMID: 36237211 Free PMC article.
-
Increased Expression of Integrin Alpha 6 in Nucleus Pulposus Cells in Response to High Oxygen Tension Protects against Intervertebral Disc Degeneration.Oxid Med Cell Longev. 2021 Oct 18;2021:8632823. doi: 10.1155/2021/8632823. eCollection 2021. Oxid Med Cell Longev. 2021. PMID: 34707783 Free PMC article.
References
-
- Agrawal A., Guttapalli A., Narayan S., Albert T. J., Shapiro I. M., Risbud M. V. (2007). Normoxic stabilization of HIF-1alpha drives glycolytic metabolism and regulates aggrecan gene expression in nucleus pulposus cells of the rat intervertebral disk. Am. J. Physiol. Cell Physiol. 293, C621–631. 10.1152/ajpcell.00538.2006 - DOI - PubMed
LinkOut - more resources
Full Text Sources
Research Materials
Miscellaneous

