. 2019 Apr 17;5(4):eaav6326.
doi: 10.1126/sciadv.aav6326. eCollection 2019 Apr.

Physical and geometric determinants of transport in fetoplacental microvascular networks

Affiliations

Physical and geometric determinants of transport in fetoplacental microvascular networks

Alexander Erlich et al. Sci Adv. .

Abstract

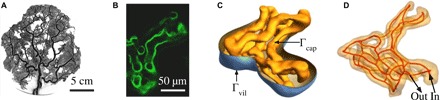
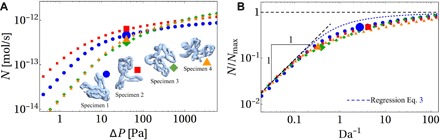
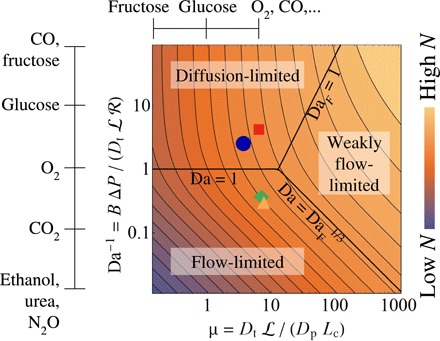
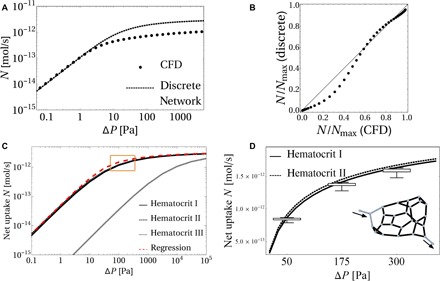
Across mammalian species, solute exchange takes place in complex microvascular networks. In the human placenta, the primary exchange units are terminal villi that contain disordered networks of fetal capillaries and are surrounded externally by maternal blood. We show how the irregular internal structure of a terminal villus determines its exchange capacity for diverse solutes. Distilling geometric features into three parameters, obtained from image analysis and computational fluid dynamics, we capture archetypal features of the structure-function relationship of terminal villi using a simple algebraic approximation, revealing transitions between flow- and diffusion-limited transport at vessel and network levels. Our theory accommodates countercurrent effects, incorporates nonlinear blood rheology, and offers an efficient method for testing network robustness. Our results show how physical estimates of solute transport, based on carefully defined geometrical statistics, provide a viable method for linking placental structure and function and offer a framework for assessing transport in other microvascular systems.


Figures

Fig. 1
Fig. 1. Multiscale structure of the fetoplacental vasculature.
(A) Fetoplacental arterial vessels [imaged using micro x-ray tomography; reproduced with permission via CC-BY from (16)] deliver blood from the umbilicus through numerous bifurcating vessels to peripheral capillary networks [e.g., (B), imaged using confocal microscopy]. The fetoplacental vasculature is confined within villous trees that are coated with syncytiotrophoblast and are bathed in maternal blood; capillary networks sit within terminal villi, the peripheral branches of the trees. (C) A segmented confocal image of a terminal villus reveals the surface Γcap of fetal capillaries (yellow) and the surrounding syncytiotrophoblast (blue; Γvil) that interfaces with maternal blood. Image processing yields capillary centerlines (red) (D), which have total length Lc. The assumed inlet and outlet vessels are indicated. Fetal blood occupies the volume Ωb confined by Γcap; villous tissue occupies the space between Γcap and Γvil.
Fig. 2
Fig. 2. Predictions of solute flux versus transport parameters.
Computational data (A) show appreciable collapse when plotted using suitable dimensionless variables (B). (A) Computed solute flux N in four segmented villus networks (specimens 1 to 4) plotted against the pressure drop ΔP driving flow through each network. (B) The same data presented in terms of the inverse Damköhler number (see Eq. 2) and solute flux scaled on each specimen’s diffusion-limited upper bound Nmax. Da−1 is proportional to the pressure drop driving flow through the network. Predicted fluxes for each specimen (small colored symbols) collapse toward a common relationship. Dashed lines show the approximation Eq. 3 and its asymptotes. For specimen 1, the largest deviation between the approximation Eq. 3 and the computational result is 24%. The large symbols in (A) and (B) compare fluxes in each specimen evaluated at a fixed inlet-outlet pressure drop ΔP = 40 Pa. We consider this value of ΔP physiological as it leads to shear stresses in specimen 1 below approximately 1.2 Pa, which we identify in section S2 to be a physiological value.
Fig. 3
Fig. 3. A diagram summarizing transport regimes in the parameter space spanned by μ (see Eq. 1), measuring the tissue’s capacity for diffusive transport relative to diffusion in the vessel network, and Da−1 (see Eq. 2), which is proportional to flow.
Contours and background color indicate the network solute flux N (see Eq. 3), evaluated for fixed Δc and Lc. The diffusion-limited regime [Da−1 ≫ max(1,μ2)], for which NNmax, and two flow-limited regimes are indicated. In the strongly flow-limited state [Da−1 ≪ min(1,μ−1)], flux is proportional to flow (NNmaxDa−1), corresponding to an asymptote shown in Fig. 2B. In the weakly flow-limited state (μ−1 ≪ Da−1 ≪ μ), concentration boundary layers arise within capillaries and NNmaxDa−1/32/3. The large colored symbols correspond to those in Fig. 2, placing oxygen transport in specimens 1 to 4 outside the weakly flow-limited regime, spanning the interface of strongly flow- and diffusion-limited regimes. Vertical and horizontal bars outside the figure indicate the relative μ and Da−1 values of a variety of solutes with respect to oxygen based on data in table S1. The upper limits of the ranges of table S1 are shown. For instance, Da−1 of glucose is approximately 10 times higher compared with oxygen, and μ of glucose is approximately 10 times lower.
Fig. 4
Fig. 4. Solute exchange heterogeneity at the level of individual capillaries.
(A) The nine longest capillaries of specimen 1 are highlighted in color; the rest of the network is shown in light blue. Arrows indicate inlet and outlet in three projections of the network. The blue capillary near the inlet neighbors the green and magenta capillaries near the outlet; likewise, red (near inlet) neighbors orange and black (near outlet). (B) Scaled net uptake of vessel j, Nj/Nmaxj, as a function of the pressure drop ΔP across the whole network exhibits nonmonotonicity in some cases, due to a donor-recipient mechanism explored in (D) and (E). The inset shows a log-log plot of the same data as a function of (Daj)−1, highlighting a collapse of the data similarly to the whole network (Fig. 2B), with the exception of donor capillaries for which N becomes negative (truncated curves). (C) Relative contributions of different capillaries to the net uptake of the entire network. The inlet-outlet pressure drop in the flow-limited (FL) regime is ΔP = 0.04 Pa, in the intermediate (IM) regime is ΔP = 1.26 Pa, and in the diffusion-limited (DL) regime is ΔP = 186 Pa. (D) Simplified capillary loop model system of donor-recipient mechanism, from a computation in two spatial dimensions. Red arrows illustrate directions of diffusive flux in the surrounding tissue; capillary boundaries are shown as white lines. At intermediate pressure drops, a countercurrent effect extracts solute from the bottom capillary (acting as a donor) into the top capillary (recipient). The net fluxes of the inlet recipient and outlet donor capillaries as a function of pressure drop (E) show the same characteristic behavior as demonstrated in (B): At intermediate pressure drops, the donor(s) switch sign, whereas the recipient surpasses its carrying capacity Nmax, but this effect is integrated out at the level of the whole system (whole loop).
Fig. 5
Fig. 5. A comparison between the discrete network versus CFD models of oxygen transfer in specimen 1.
[topology shown as an inset to (D)]. (A) Comparison of the solute flux N versus network pressure drop ΔP as predicted by the computational model (section S2) and the discrete network model (section S4). (B) Same data when rescaled by relevant values of Nmax. (C) Dependence of the discrete network-predicted oxygen net transfer rate N on hematocrit distribution. The oxygen transfer rate for varying ΔP for the entire network is predicted assuming uniform hematocrit and facilitated transport (B = 141, hematocrit I, solid line), spatially variable hematocrit [B = B(H), hematocrit II, dashed line], and uniform hematocrit but without facilitated transport (B = 1, hematocrit III, thin dashed line). The regression equation Eq. 3 applied to the entire discrete network is shown as the red dashed line (see section S4). (D) Sensitivity of net oxygen flux to removal of individual vessels. The solid curves replicate those within the orange box in (C). For three different pressure drops (ΔP = 50, 175, and 300 Pa), we calculated 33 values of N with each of the 33 black capillaries (inset) removed individually. The resulting distribution for the nonuniform hematocrit model is shown with box plots, demonstrating that the network is robust with respect to the occlusion of individual capillaries.

Similar articles

Cited by

References

    1. Burton G. J., Fowden A. L., The placenta: A multifaceted, transient organ. Phil. Trans. R Soc. B 370, 20140066 (2015). - PMC - PubMed
    1. Serov A. S., Salafia C., Grebenkov D. S., Filoche M., The role of morphology in mathematical models of placental gas exchange. J. Appl. Physiol. 120, 17–28 (2016). - PubMed
    1. Jensen O. E., Chernyavsky I. L., Blood flow and transport in the human placenta. Annu. Rev. Fluid Mech. 51, 25–47 (2019). - PMC - PubMed
    1. Secomb T. W., Alberding J. P., Hsu R., Dewhirst M. W., Pries A. R., Angiogenesis: An adaptive dynamic biological patterning problem. PLOS Comput. Biol. 9, e1002983 (2013). - PMC - PubMed
    1. Fry B. C., Roy T. K., Secomb T. W., Capillary recruitment in a theoretical model for blood flow regulation in heterogeneous microvessel networks. Physiol. Rep. 1, e0050 (2013). - PMC - PubMed

Publication types

LinkOut - more resources