. 2019 Apr 17;5(4):eaav7803.
doi: 10.1126/sciadv.aav7803. eCollection 2019 Apr.

Critical role of spectrin in hearing development and deafness

Affiliations

Critical role of spectrin in hearing development and deafness

Yan Liu et al. Sci Adv. .

Abstract

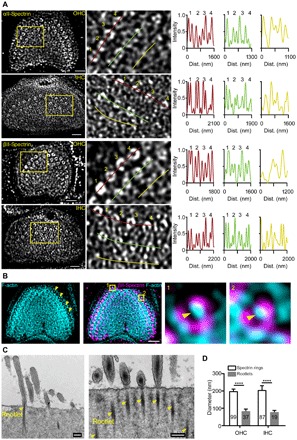
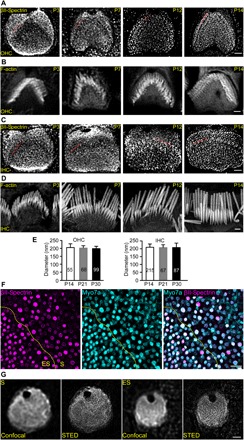
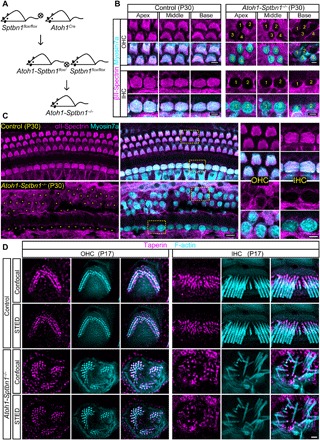
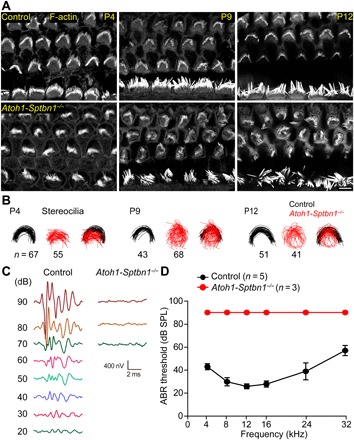
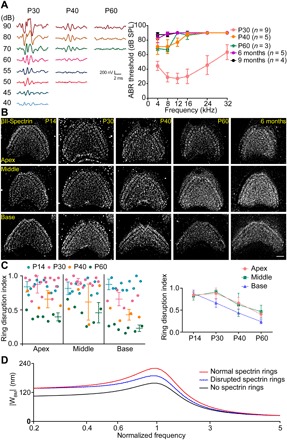
Inner ear hair cells (HCs) detect sound through the deflection of mechanosensory stereocilia. Stereocilia are inserted into the cuticular plate of HCs by parallel actin rootlets, where they convert sound-induced mechanical vibrations into electrical signals. The molecules that support these rootlets and enable them to withstand constant mechanical stresses underpin our ability to hear. However, the structures of these molecules have remained unknown. We hypothesized that αII- and βII-spectrin subunits fulfill this role, and investigated their structural organization in rodent HCs. Using super-resolution fluorescence imaging, we found that spectrin formed ring-like structures around the base of stereocilia rootlets. These spectrin rings were associated with the hearing ability of mice. Further, HC-specific, βII-spectrin knockout mice displayed profound deafness. Overall, our work has identified and characterized structures of spectrin that play a crucial role in mammalian hearing development.


Figures

Fig. 1
Fig. 1. Structure of αII- and βII-spectrin in the cuticular plate.
(A) Representative STED images of αII- and βII-spectrin from mouse OHCs and IHCs at P21, with magnification of yellow boxed regions on the right. Intensity profiles along the solid lines are shown. The rings are numerically labeled, and corresponding intensity curves are shown (n = 3 mice). Scale bars, 1 μm. (B) Representative two-color STED image of βII-spectrin (magenta) and F-actin (cyan) in the cuticular plate of OHC and the magnification region indicated by yellow boxes. Yellow triangles indicate that the rootlet is found inside the spectrin ring. Scale bar, 1 μm. (C) Representative transmission electron micrographs of the apical region of HCs from mice, with the sections parallel to the stereocilia staircase (left) and stereocilia row (right) (n = 3 mice). Scale bars, 200 nm. (D) Size comparison among spectrin rings and stereocilia rootlets. n = ring numbers or rootlet numbers from three to five mice for each group. ****P < 0.0001, Student’s t test. Error bars ± SD.
Fig. 2
Fig. 2. Spectrin structure in HCs during postnatal development.
(A) Representative STED images of βII-spectrin staining in the cuticular plates of OHCs at different developmental stages. n = 3 to 8 mice from each stage. Scale bar, 1 μm. (B) Representative confocal images of stereocilia in OHCs at different developmental stages (n = 3 to 5 mice from each stage). Scale bar, 1 μm. (C and D) Same as (A) and (B), but for IHCs at different developmental stages. (C) n = 4 to 9 mice from each stage; (D) n = 3 to 5 mice from each stage. Scale bars, 1 μm. (E) Spectrin ring diameter comparison among different developmental stages in OHCs and IHCs, respectively. n = ring numbers from three to five mice for each group. No significances. Two-way analysis of variance (ANOVA). Error bars ± SD. (F) Representative confocal images of βII-spectrin (magenta) and myosin7a (cyan) in utricle from P14 mice (n = 3 mice). S, striolar region; ES, extrastriolar region. Scale bar, 15 μm. (G) Representative confocal and STED images of βII-spectrin in VHCs (n = 3 mice). Scale bar, 1 μm.
Fig. 3
Fig. 3. Spectrin is required for the right distribution of taperin in HCs.
(A) Schematic methodology of generating βII-spectrin HC-specific KO mice. (B) Representative confocal images of βII-spectrin signals in the HCs in apical, middle, and basal turns from control mice (n = 3 mice) and Atoh1-Sptbn1−/− mice at P30 (n = 3 mice). Yellow numbers indicate the location of HCs. Scale bars, 4 μm. (C) Same as (B), but for αII-spectrin (n = 3 mice). Scale bars, 10 μm (left) and 5 μm (right). (D) Representative confocal and STED images of taperin (magenta) and F-actin (cyan) from control mice (n = 3 mice) and Atoh1-Sptbn1−/− mice (n = 3 mice) at P17. Scale bar, 1 μm.
Fig. 4
Fig. 4. Spectrin is essential for HCs and hearing development.
(A) Representative confocal images of F-actin from control mice and Atoh1-Sptbn1−/− mice at P4 (n = 3 mice), P9 (n = 3 mice), and P12 (n = 3 mice). Scale bar, 5 μm. (B) Stereocilia morphology tracing in the cuticular plate of OHCs from control mice and Atoh1-Sptbn1−/− mice at P4, P9, and P12. The root of stereocilia from each HC was traced to determine the polarity changes of stereocilia. We first aligned the edges of each OHC to ensure that the relative position of the stereocilia is comparable to each other, and then we drew a line along the roots of the stereocilia to show the changes of stereocilia polarity. n = tracing numbers from three to five mice for each group. (C) Representative ABR traces recorded from control mice (n = 5 mice) and Atoh1-Sptbn1−/− mice (n = 3 mice) at P30, with a 12-kHz tone burst between 20 and 90 dB. (D) ABR results of control and Atoh1-Sptbn1−/− mice. Error bars ± SD.
Fig. 5
Fig. 5. Spectrin rings are associated with hearing ability.
(A) Left: Representative traces recorded from CD-1 mice at P30, P40, and P60. The stimulus was a 12-kHz tone burst between 40 and 90 dB. Right: Representative ABR results of CD-1 mice at P30, P40, P60, 6 months, and 9 months. n = mice numbers from different development stages. (B) Representative STED images of βII-spectrin in the apical, middle, and basal turns from P14, P30, P40, P60, and 6-month CD-1 mice. n = 3 mice from each stage. Scale bar, 1 μm. (C) Ring disruption index of P14 (n = 29 cells from five mice), P30 (n = 30 cells from four mice), P40 (n = 16 cells from three mice), and P60 (n = 20 cells from three mice) CD-1 mice. (D) The predicted transverse motions of BM were compared under different conditions: normal spectrin rings, reduced spectrin rings, and no spectrin rings in the cuticular plate of the OHCs. Normalized frequency was calculated as Freq/CF(x0). |WBM|, BM displacement. Error bars ± SD.

Similar articles

Cited by

References

    1. DeRosier D. J., Tilney L. G., The structure of the cuticular plate, an in vivo actin gel. J. Cell Biol. 109, 2853–2867 (1989). - PMC - PubMed
    1. Tilney L. G., Egelman E. H., DeRosier D. J., Saunder J. C., Actin filaments, stereocilia, and hair cells of the bird cochlea. II. Packing of actin filaments in the stereocilia and in the cuticular plate and what happens to the organization when the stereocilia are bent. J. Cell Biol. 96, 822–834 (1983). - PMC - PubMed
    1. Tilney L. G., DeRosier D. J., Actin filaments, stereocilia, and hair cells of the bird cochlea: IV. How the actin filaments become organized in developing stereocilia and in the cuticular plate. Dev. Biol. 116, 119–129 (1986). - PubMed
    1. Scheffer D. I., Zhang D.-S., Shen J., Indzhykulian A., Karavitaki K. D., Xu Y. J., Wang Q., Lin J. J.-C., Chen Z.-Y., Corey D. P., XIRP2, an actin-binding protein essential for inner ear hair-cell stereocilia. Cell Rep. 10, 1811–1818 (2015). - PMC - PubMed
    1. Vranceanu F., Perkins G. A., Terada M., Chidavaenzi R. L., Ellisman M. H., Lysakowski A., Striated organelle, a cytoskeletal structure positioned to modulate hair-cell transduction. Proc. Natl. Acad. Sci. U.S.A. 109, 4473–4478 (2012). - PMC - PubMed

Publication types

Substances