. 2019 Jul;62(7):1275-1290.
doi: 10.1007/s00125-019-4865-6. Epub 2019 Apr 17.

Bone marrow pericyte dysfunction in individuals with type 2 diabetes

Affiliations

Bone marrow pericyte dysfunction in individuals with type 2 diabetes

Giuseppe Mangialardi et al. Diabetologia. 2019 Jul.

Erratum in

Abstract

Aims/hypothesis: Previous studies have shown that diabetes mellitus destabilises the integrity of the microvasculature in different organs by damaging the interaction between pericytes and endothelial cells. In bone marrow, pericytes exert trophic functions on endothelial cells and haematopoietic cells through paracrine mechanisms. However, whether bone marrow pericytes are a target of diabetes-induced damage remains unknown. Here, we investigated whether type 2 diabetes can affect the abundance and function of bone marrow pericytes.

Methods: We conducted an observational clinical study comparing the abundance and molecular/functional characteristics of CD146+ pericytes isolated from the bone marrow of 25 individuals without diabetes and 14 individuals with uncomplicated type 2 diabetes, referring to our Musculoskeletal Research Unit for hip reconstructive surgery.

Results: Immunohistochemistry revealed that diabetes causes capillary rarefaction and compression of arteriole size in bone marrow, without changing CD146+ pericyte counts. These data were confirmed by flow cytometry on freshly isolated bone marrow cells. We then performed an extensive functional and molecular characterisation of immunosorted CD146+ pericytes. Type 2 diabetes caused a reduction in pericyte proliferation, viability, migration and capacity to support in vitro angiogenesis, while inducing apoptosis. AKT is a key regulator of the above functions and its phosphorylation state is reportedly reduced in the bone marrow endothelium of individuals with diabetes. Surprisingly, we could not find a difference in AKT phosphorylation (at either Ser473 or Thr308) in bone marrow pericytes from individuals with and without diabetes. Nonetheless, the angiocrine signalling reportedly associated with AKT was found to be significantly downregulated, with lower levels of fibroblast growth factor-2 (FGF2) and C-X-C motif chemokine ligand 12 (CXCL12), and activation of the angiogenesis inhibitor angiopoietin 2 (ANGPT2). Transfection with the adenoviral vector carrying the coding sequence for constitutively active myristoylated AKT rescued functional defects and angiocrine signalling in bone marrow pericytes from diabetic individuals. Furthermore, an ANGPT2 blocking antibody restored the capacity of pericytes to promote endothelial networking.

Conclusions/interpretation: This is the first demonstration of pericyte dysfunction in bone marrow of people with type 2 diabetes. An altered angiocrine signalling from pericytes may participate in bone marrow microvascular remodelling in individuals with diabetes.

Keywords: Angiocrine factors; Bone marrow; Diabetes; Microangiopathy; Pericytes.


Figures

Fig. 1
Fig. 1
Characterisation of bone marrow pericytes in situ. Representative fluorescence microscopy images showing expression of CD146 (a), CXCL12 (b) and nestin (c) by cells localised around bone marrow capillaries of non-diabetic and diabetic individuals. Scale bars, 20 μm. ND, non-diabetic; T2D, type 2 diabetes
Fig. 2
Fig. 2
Immunohistochemical characterisation of CD146+ pericytes in human bone marrow. (a, b) Representative fluorescence microscopy images showing that CD146+ cells (red) express αSMA (green) (a) and co-localise with nerve profiles expressing PGP9.5 (green) (b) in capillaries of bone marrow from both non-diabetic and diabetic individuals. Scale bars, 20 μm. (c) Immunohistochemistry analysis of bone marrow vasculature performed by staining for CD146 (red) and VWF (green). Scale bars, 50 μm. Arrows point to PGP9.5- and VWF-positive structures. (d) Quantification of VWF-positive capillaries. Data are expressed as individual values and mean ± SEM; n=3 per group. *p<0.05, Student’s t test. (e) Distribution of arterioles according to their size. ND, non-diabetic; T2D, type 2 diabetes
Fig. 3
Fig. 3
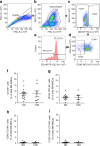
Flow cytometry assessment of bone marrow pericytes. Freshly isolated bone marrow mononuclear cells (BM-MNCs) were analysed by flow cytometry for CD146, CD34 and CD45 markers. (ae) The gating strategy consisted of selecting singlet populations using FSC-height (FSC-H) by FSC-area (FSC-A) (a), followed SSC-A by FSC-A (b) to exclude false-positive events, which are outside the indicated boundaries. Following this, the total BM-MNC population was gated according to the expression of the surface antigen CD34 (c). CD34 events were gated and further analysed for CD45 (d). Finally, the CD45CD34 cell population was assessed according to CD146 positivity, using the fluorophore PE-Cy7-A (e). (fi) Bar graphs showing the abundance of CD146+ (f), CD34CD146+ (g), CD45CD146+ (h) and CD34CD45CD146+ cells (i) within BM-MNCs from non-diabetic (n=15) and diabetic (n=10) individuals. Data are expressed as individual values and mean±SEM. Analysis was performed using Student’s t test. FSC, forward scatter; ND, non-diabetic; SSC, side scatter; T2D, type 2 diabetes
Fig. 4
Fig. 4
Characterisation of CD146+ pericytes following culture expansion. CD146+ pericytes were selected through immunomagnetic sorting and then expanded. (a, b) Flow cytometry data showing a similar profile of expanded cells in non-diabetic and diabetic individuals. Cells expressed CD146, CD105, CD73 and CD90 and were negative for CD14, CD34, CD45 and CD31. n=6 per group. The bar and whisker graph shows mean, 25th–75th percentile and minimum and maximum values (a). Analysis was performed by Student’s t test. (b) Histogram overlays with positive staining illustrated by the light blue shading and isotype control by the pink shading. (c) Fluorescent microscopy immunostaining images showing cell positivity for CD146, NG2, nestin, LEPROT, PDGFRβ, CXCL12 and VEGFR2. Expanded CD146+ pericytes did not express VWF or VE-cadherin. Scale bars, 50 μm. ND, non-diabetic; T2D, type 2 diabetes
Fig. 5
Fig. 5
Diabetes alters the functional profile of CD146+ pericytes. Bar graphs showing the results of BrdU assay (a), MTS assay (b) and flow cytometry analysis of early (c) and late apoptosis (d). (e) Representative plots of flow cytometry data shown in (c) and (d). (f) Bar graph showing the results of the migration assay in which CD146+ pericytes were exposed to a gradient of PDGFB in a transwell chemotactic assay. (g, h) Representative images (g) and bar graph (h) of the Matrigel assay, showing a reduced ability of HUVECs to form capillary-like structures upon co-culture with CD146+ pericytes from individuals with type 2 diabetes or their conditioned medium. n=5 (ad) or n=3 per group (f, h). Data are shown as individual values and mean ± SEM; *p<0.05, **p<0.01 vs non-diabetic group; p<0.05 vs HUVECs alone, Student’s t test. AnnV, Annexin V; CM, conditioned medium; ND, non-diabetic; PC, pericytes; PI, propidium iodide; T2D, type 2 diabetes
Fig. 6
Fig. 6
Diabetes alters the gene expression profile of CD146+ pericytes. Bar graphs showing results of qPCR analysis performed for ANGPT1 (a), ANGPT2 (b), TIE2 (c), VEGFA (d), VEGFB (e), IGFBP2 (f), EFNB2 (g), DLK1 (h), DLK4 (also known as DLL4) (i), JAG1 (j), FGF2 (k), CXCL12 (l), LEP (m), NRP (n), SEMA6A (o), SPRY (p) and THBS1 (q). Data are expressed as individual values and mean ± SEM, fold change vs non-diabetic group; n=6 (non-diabetic group) or n=4 (diabetic group). *p<0.05, **p<0.01, ***p<0.001 vs non-diabetic group, Student’s t test. ND, non-diabetic; T2D, type 2 diabetes
Fig. 7
Fig. 7
Diabetes alters the secretome of CD146+ pericytes. Bar graphs showing results of ELISA for ANGPT1 (a), ANGPT2 (b), VEGFA (c), VEGFB (d), IGFBP2 (e), FGF2 (f), CXCL12 (g) and SEMA6A (h). Data are shown as individual values and mean±SEM; n=4–10 (non-diabetic group) and n=4–9 (diabetic group). *p<0.05, ***p<0.001 vs non-diabetic group, Student’s t test. ND, non-diabetic; T2D, type 2 diabetes
Fig. 8
Fig. 8
The presence of Ad-myrAKT rescues the dysfunction of CD146+ pericytes taken from diabetic individuals. CD146+ pericytes from non-diabetic or diabetic individuals were infected with Ad-myrAKT or Ad-Null and were then assessed for proliferation (a), viability (b), apoptosis (ce) and migration (f). The gating strategy to distinguish different subfractions of cells based on the expression of Annexin V and PI is shown in the representative scattergrams (e). CD146+ pericytes from non-diabetic or diabetic individuals were also assessed for capacity to support angiogenesis in a Matrigel assay with HUVECs, either in co-culture (g) or using the CD146+ pericyte conditioned medium (h). (i–l) Graphs showing the results of ELISA performed on the conditioned media of CD146+ pericytes from non-diabetic or diabetic individuals infected with Ad-myrAKT or Ad-Null; ANGPT1 (i), ANGPT2 (j), FGF2 (k) and CXCL12 (l) were measured. Bar and whisker graphs show mean, 25th–75th percentile and minimum and maximum values; n=5 per group. *p<0.05, **p<0.01, ***p<0.001 vs the corresponding Ad-myrAKT or Ad-Null infected non-diabetic group; p<0.05 and ††p<0.01 vs Ad-Null infected diabetic group, ANOVA followed by Bonferroni post hoc t test. The key in (a) applies to all figure parts. AnnV, Annexin V; ND, non-diabetic; PerCP, peridinin chlorophyll protein complex; PI, propidium iodide; T2D, type 2 diabetes
Fig. 9
Fig. 9
Inhibition of ANGPT2 by a blocking antibody restores the ability of pericytes from diabetic individuals to promote endothelial network formation. Pericytes from non-diabetic or diabetic individuals were treated with anti-ANGPT2 antibody or with IgG isotype control. Their conditioned media was harvested and used to stimulate the formation of networks by HUVECs on Matrigel. (a, b) Representative images (a) and bar graph (b) showing that conditioned media of pericytes from diabetic individuals inhibits endothelial network formation compared with conditioned media of pericytes from non-diabetic individuals. (c, d) Representative images (c) and bar graph (d) showing that the inhibition exerted by the conditioned media of pericytes from diabetic individuals is abrogated by an ANGPT2 blocking antibody. Bar and whisker graphs show mean, 25th–75th percentile and minimum and maximum values. n=3 per group. **p<0.01 vs non-diabetic, Student’s t test. Ab, antibody; CM, conditioned medium; ND, non-diabetic; PC, pericyte; T2D, type 2 diabetes

Similar articles

Cited by

References

    1. Beckman JA, Paneni F, Cosentino F, Creager MA. Diabetes and vascular disease: pathophysiology, clinical consequences, and medical therapy: part II. Eur Heart J. 2013;34(31):2444–2452. doi: 10.1093/eurheartj/eht142. - DOI - PubMed
    1. Hossain P, Kawar B, El Nahas M. Obesity and diabetes in the developing world--a growing challenge. N Engl J Med. 2007;356(3):213–215. doi: 10.1056/NEJMp068177. - DOI - PubMed
    1. Paneni F, Costantino S, Volpe M, Luscher TF, Cosentino F. Epigenetic signatures and vascular risk in type 2 diabetes: a clinical perspective. Atherosclerosis. 2013;230(2):191–197. doi: 10.1016/j.atherosclerosis.2013.07.003. - DOI - PubMed
    1. Fadini GP, Ciciliot S, Albiero M. Concise review: perspectives and clinical implications of bone marrow and circulating stem cell defects in diabetes. Stem Cells. 2017;35(1):106–116. doi: 10.1002/stem.2445. - DOI - PubMed
    1. Mangialardi G, Madeddu P. Bone marrow-derived stem cells: a mixed blessing in the multifaceted world of diabetic complications. Curr Diab Rep. 2016;16(5):43. doi: 10.1007/s11892-016-0730-x. - DOI - PMC - PubMed

Publication types