. 2019 Jul;62(7):1154-1166.
doi: 10.1007/s00125-019-4859-4. Epub 2019 Apr 17.

Canagliflozin reduces inflammation and fibrosis biomarkers: a potential mechanism of action for beneficial effects of SGLT2 inhibitors in diabetic kidney disease

Affiliations

Canagliflozin reduces inflammation and fibrosis biomarkers: a potential mechanism of action for beneficial effects of SGLT2 inhibitors in diabetic kidney disease

Hiddo J L Heerspink et al. Diabetologia. 2019 Jul.

Abstract

Aims/hypothesis: The sodium-glucose cotransporter 2 (SGLT2) inhibitor canagliflozin slows progression of kidney function decline in type 2 diabetes. The aim of this study was to assess the effect of the SGLT2 inhibitor canagliflozin on biomarkers for progression of diabetic kidney disease (DKD).

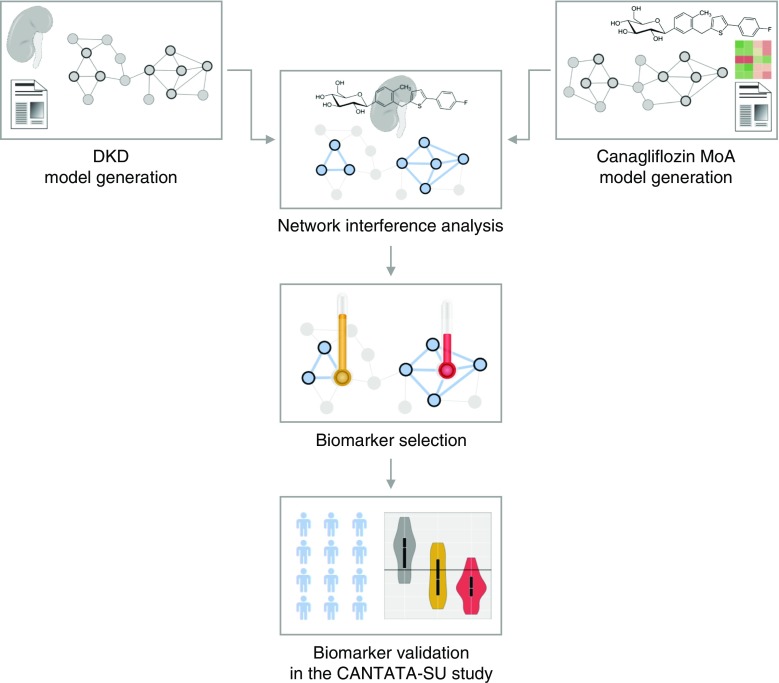
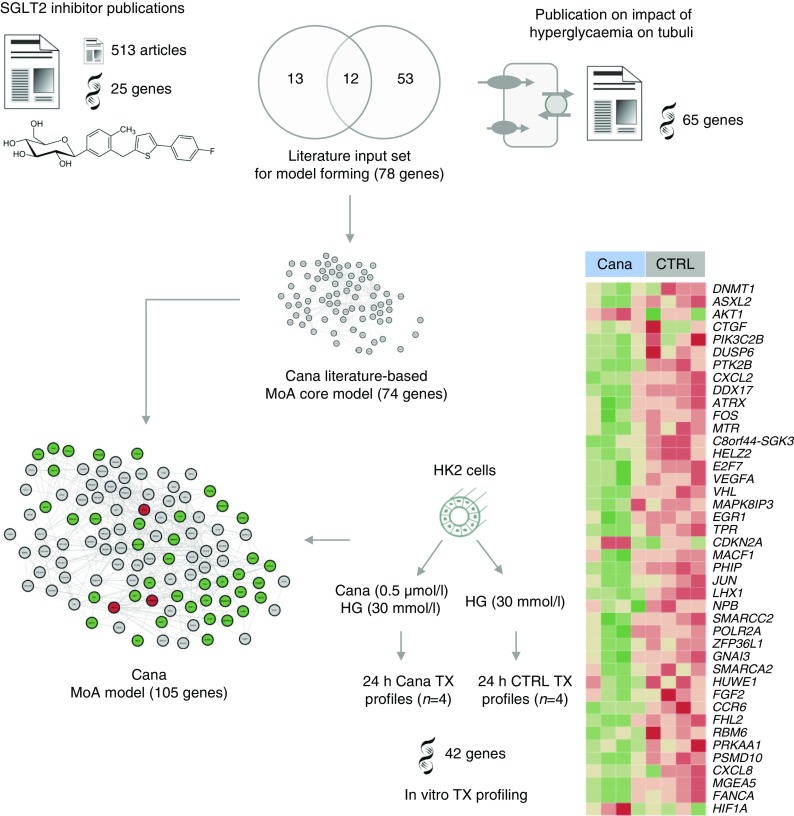
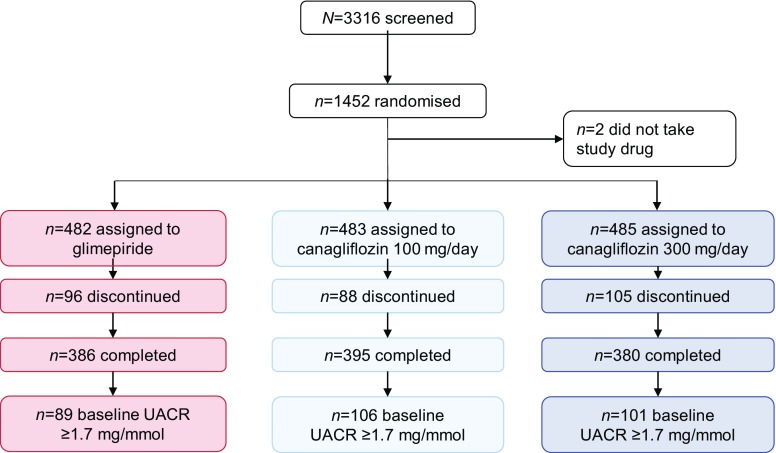
Methods: A canagliflozin mechanism of action (MoA) network model was constructed based on an in vitro transcriptomics experiment in human proximal tubular cells and molecular features linked to SGLT2 inhibitors from scientific literature. This model was mapped onto an established DKD network model that describes molecular processes associated with DKD. Overlapping areas in both networks were subsequently used to select candidate biomarkers that change with canagliflozin therapy. These biomarkers were measured in 296 stored plasma samples from a previously reported 2 year clinical trial comparing canagliflozin with glimepiride.

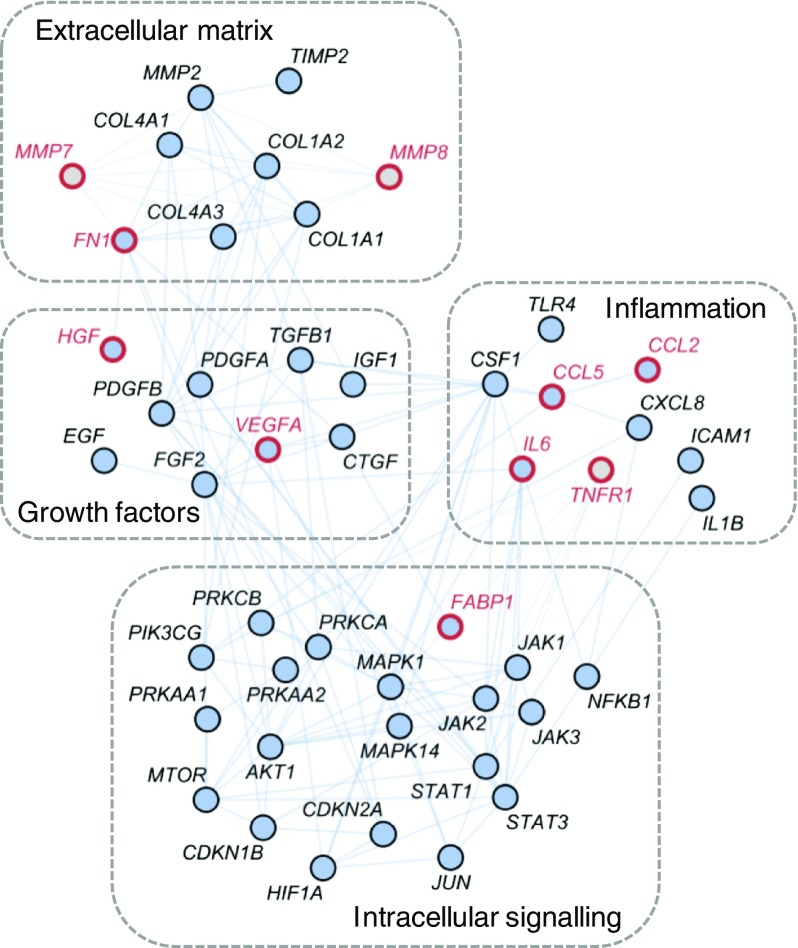
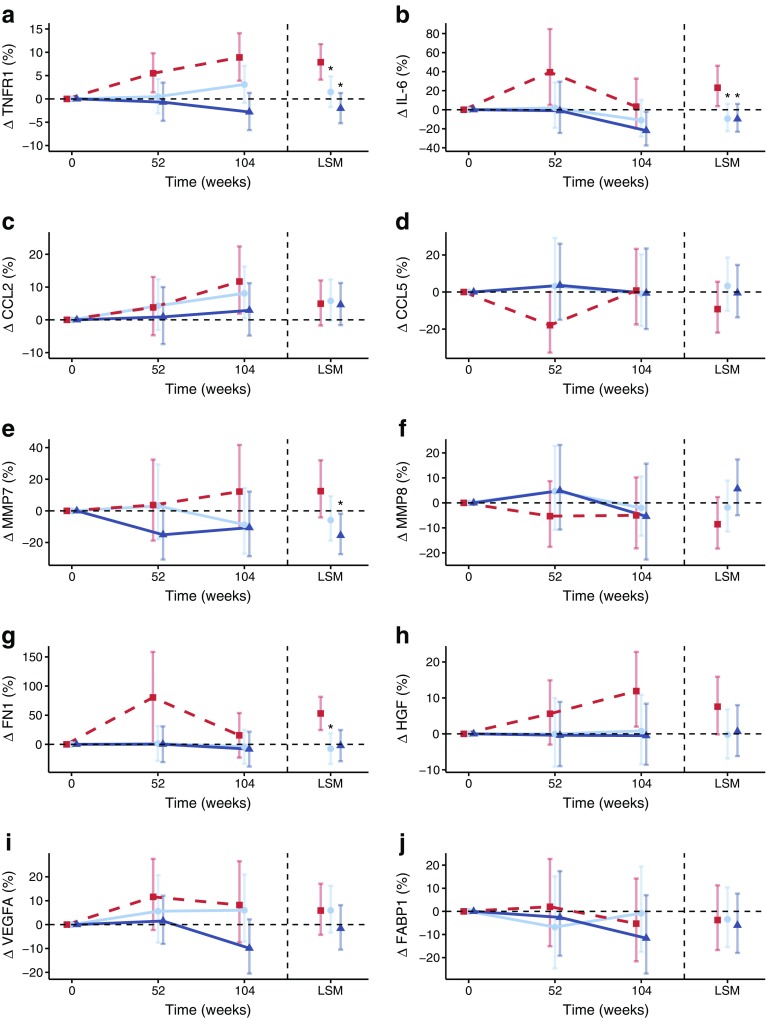
Results: Forty-four proteins present in the canagliflozin MoA molecular model overlapped with proteins in the DKD network model. These proteins were considered candidates for monitoring impact of canagliflozin on DKD pathophysiology. For ten of these proteins, scientific evidence was available suggesting that they are involved in DKD progression. Of these, compared with glimepiride, canagliflozin 300 mg/day decreased plasma levels of TNF receptor 1 (TNFR1; 9.2%; p < 0.001), IL-6 (26.6%; p = 0.010), matrix metalloproteinase 7 (MMP7; 24.9%; p = 0.011) and fibronectin 1 (FN1; 14.9%; p = 0.055) during 2 years of follow-up.

Conclusions/interpretation: The observed reduction in TNFR1, IL-6, MMP7 and FN1 suggests that canagliflozin contributes to reversing molecular processes related to inflammation, extracellular matrix turnover and fibrosis. Trial registration ClinicalTrials.gov NCT00968812.

Keywords: Biomarkers; Canagliflozin; Chronic kidney disease; Sodium–glucose cotransporter 2 inhibitors; Type 2 diabetes.


Figures

Fig. 1
Fig. 1
Study analysis overview scheme. Molecular models were generated based on literature-derived data as well as in vitro-derived transcriptomics profiles for DKD and canagliflozin. Network interference analysis led to identification of pathophysiological DKD processes affected by canagliflozin treatment. Biomarkers in areas of network interference were selected and validated in samples from the completed CANTATA-SU clinical trial
Fig. 2
Fig. 2
Canagliflozin MoA model construction. The literature-based MoA core model was constructed based on molecular features extracted from publications on SGLT2 inhibitors as well as from a manuscript on the impact of hyperglycaemia on tubulus cells [18]. The MoA core model (consisting of 74 connected protein-coding genes out of the set of 78) was expanded by deregulated transcripts from the in vitro cell culture experiment in HK2 cells, thus leading to the final canagliflozin MoA molecular model holding 105 protein-coding genes. Up- and downregulated protein-coding genes after canagliflozin treatment in HK2 cells are highlighted in red and green, respectively, in the final canagliflozin MoA molecular model. The intensity of colour indicates the level of up- and downregulation, with darker colours representing the greatest change. Cana, canagliflozin; CTRL, control; HG, high glucose; TX, transcriptomics. MGEA5 is also known as OGA
Fig. 3
Fig. 3
DKD–drug interference signature and selected biomarkers. The 44 protein-coding genes of the DKD–drug interference signature are shown along with genes encoding the three prognostic factors, MMP7, MMP8 and TNFR1, tightly connected to the interference signature. Protein-coding genes are grouped based on mechanistic involvement and molecular function. The ten biomarkers selected for measurements with Luminex technology in the CANTATA-SU study are highlighted in red. CTGF is also known as CCN2; TNFR1 is also known as TNFRSF1A
Fig. 4
Fig. 4
Trial profile and patient disposition of the randomized controlled trial CANTATU-SU
Fig. 5
Fig. 5
Change in biomarkers during glimepiride and canagliflozin treatment. Red squares/lines, glimepiride; light blue circles/lines, canagliflozin 100 mg/day; dark blue triangles/lines, canagliflozin 300 mg/day. Least square mean (LSM) changes are provided on each graph. Data are presented as mean ± 95% CI. n = 296 for all markers. *p ≤ 0.05, canagliflozin vs glimepiride
Fig. 6
Fig. 6
Correlation (Pearson’s r) between changes in albuminuria and selected biomarkers during canagliflozin treatment. (a) Correlation between changes in biomarkers from baseline to week 52 in the overall population. (b) Correlation between changes in biomarkers from baseline to week 52 in the canagliflozin 300 mg treatment group. (c) Correlation between achieved biomarker levels at week 52 in the overall population. (d) Correlation between achieved biomarker levels at week 52 in the canagliflozin 300 mg treatment group. Red shading, statistically significant positive correlations; green shading, statistically significant negative correlations
Fig. 7
Fig. 7
Association between change in TNFR1 and change in eGFR during follow-up. (a) TNFR1 change stratified in tertiles (n = 98 in each tertile). (b) TNFR1 change stratified in subgroups: ≥30% TNFR1 reduction (n = 9); TNFR1 reduction between 30% and 0% (n = 128); >0% TNFR1 increase (n = 157)

References

    1. Afkarian M, Sachs MC, Kestenbaum B, et al. Kidney disease and increased mortality risk in type 2 diabetes. J Am Soc Nephrol. 2013;24(2):302–308. doi: 10.1681/ASN.2012070718. - DOI - PMC - PubMed
    1. Perkovic V, Agarwal R, Fioretto P, et al. Management of patients with diabetes and CKD: conclusions from a ‘Kidney Disease: Improving Global Outcomes’ (KDIGO) Controversies Conference. Kidney Int. 2016;90(6):1175–1183. doi: 10.1016/j.kint.2016.09.010. - DOI - PubMed
    1. List JF, Woo V, Morales E, Tang W, Fiedorek FT. Sodium-glucose cotransport inhibition with dapagliflozin in type 2 diabetes. Diabetes Care. 2009;32(4):650–657. doi: 10.2337/dc08-1863. - DOI - PMC - PubMed
    1. Heerspink HJ, Desai M, Jardine M, Balis D, Meininger G, Perkovic V. Canagliflozin slows progression of renal function decline independently of glycemic effects. J Am Soc Nephrol. 2017;28(1):368–375. doi: 10.1681/ASN.2016030278. - DOI - PMC - PubMed
    1. Wanner C, Inzucchi SE, Lachin JM, et al. Empagliflozin and progression of kidney disease in type 2 diabetes. N Engl J Med. 2016;375(4):323–334. doi: 10.1056/NEJMoa1515920. - DOI - PubMed

Publication types

MeSH terms

Associated data