. 2019 Jul;112(1):199-218.
doi: 10.1111/mmi.14263. Epub 2019 May 3.

The transcription factors ActR and SoxR differentially affect the phenazine tolerance of Agrobacterium tumefaciens

Affiliations

The transcription factors ActR and SoxR differentially affect the phenazine tolerance of Agrobacterium tumefaciens

Elena K Perry et al. Mol Microbiol. 2019 Jul.

Abstract

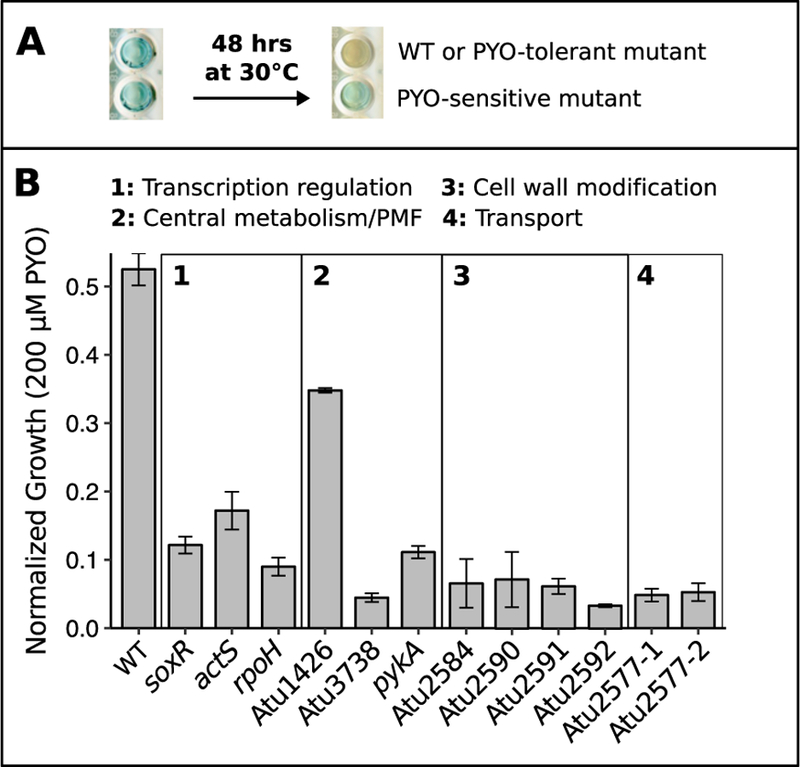
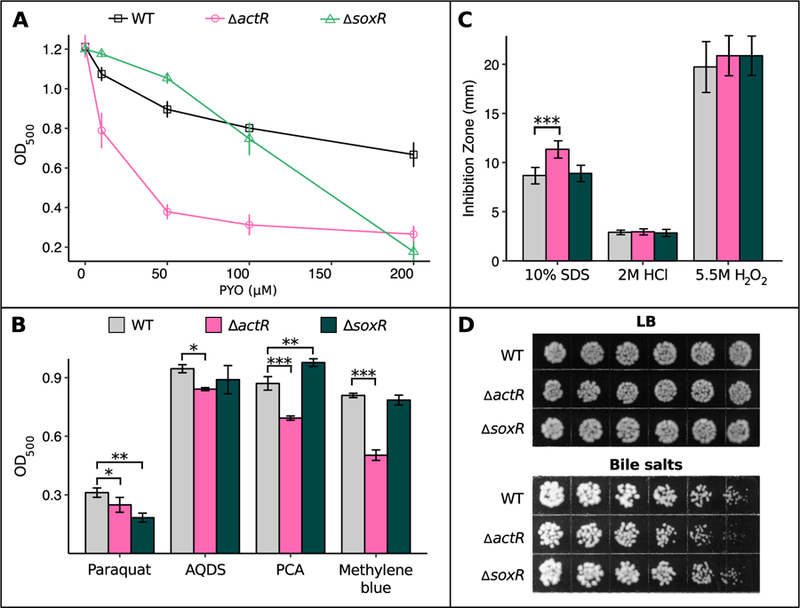
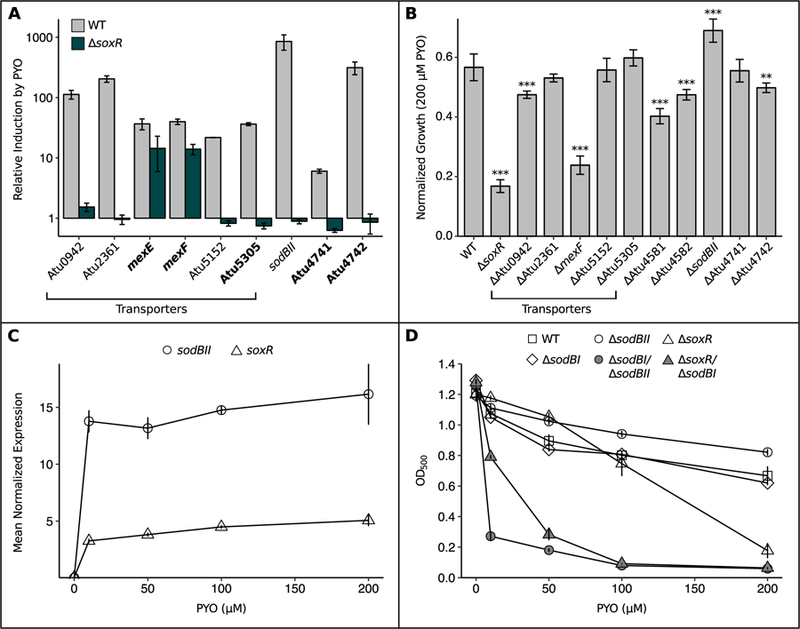
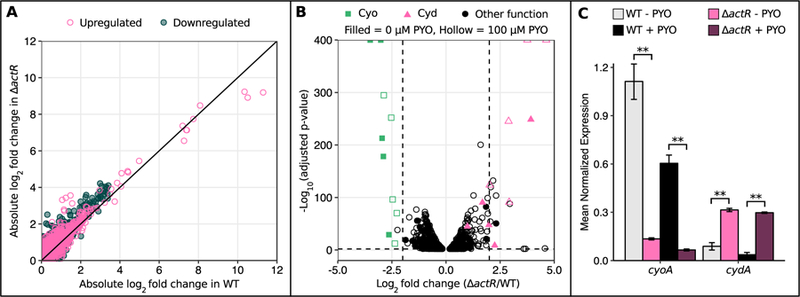
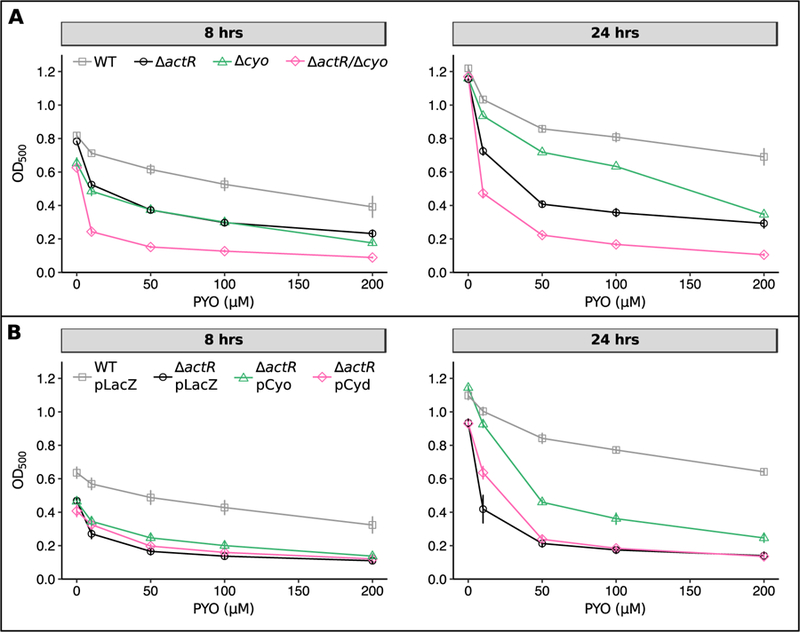
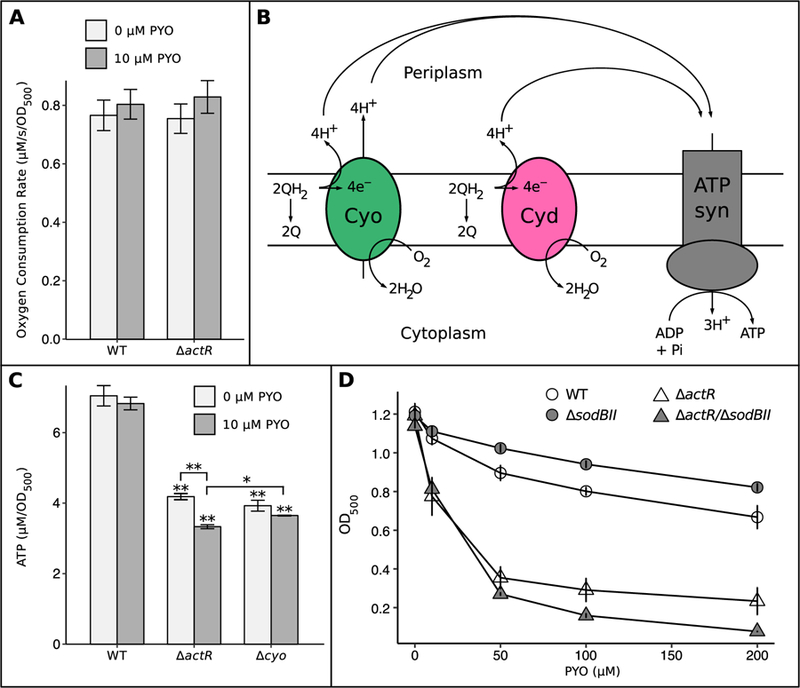
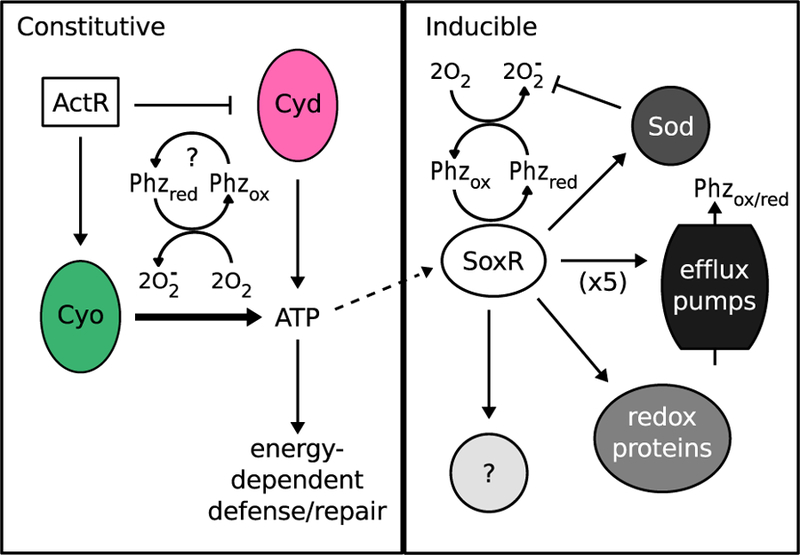
Bacteria in soils encounter redox-active compounds, such as phenazines, that can generate oxidative stress, but the mechanisms by which different species tolerate these compounds are not fully understood. Here, we identify two transcription factors, ActR and SoxR, that play contrasting yet complementary roles in the tolerance of the soil bacterium Agrobacterium tumefaciens to phenazines. We show that ActR promotes phenazine tolerance by proactively driving expression of a more energy-efficient terminal oxidase at the expense of a less efficient alternative, which may affect the rate at which phenazines abstract electrons from the electron transport chain (ETC) and thereby generate reactive oxygen species. SoxR, on the other hand, responds to phenazines by inducing expression of several efflux pumps and redox-related genes, including one of three copies of superoxide dismutase and five novel members of its regulon that could not be computationally predicted. Notably, loss of ActR is far more detrimental than loss of SoxR at low concentrations of phenazines, and also increases dependence on the otherwise functionally redundant SoxR-regulated superoxide dismutase. Our results thus raise the intriguing possibility that the composition of an organism's ETC may be the driving factor in determining sensitivity or tolerance to redox-active compounds.


Figures

Fig. 1
Fig. 1
Transposon mutagenesis reveals genes necessary for tolerance of PYO. A) An example 96-well plate demonstrating the colorimetric strategy used to identify PYO-sensitive transposon mutants. As WT or PYO-tolerant mutants grow to a high density over 48 hrs in static cultures, cellular reductants transform PYO from its blue oxidized form to its colorless reduced form. Wells containing PYO-sensitive mutants that cannot grow to a high density remain blue. B) Growth of WT and the 12 PYO-sensitive transposon mutants after 24 hrs in the presence of 200 µM PYO. Cultures were either in or approaching stationary phase at this time point, and growth was normalized to growth in parallel cultures without PYO. Differences between WT and mutants were generally greater at 200 µM PYO than at lower concentrations. Mutants are named by the gene containing the transposon insertion and categorized by predicted function (see Table S1 for further details). Error bars represent standard deviations of biological replicates (n = 3).
Fig. 2
Fig. 2
actR and ∆soxR mutants exhibit differential sensitivity to redox-active small molecules. A) Growth of WT, ∆actR, and ∆soxR after 24 hrs in the presence of different concentrations of PYO, measured by optical density at 500 nm (n = 3). B) Growth of WT, ∆actR, and ∆soxR after 24 hrs in the presence of 20 mM paraquat, 10 mM AQDS, 500 µM PCA, or 200 µM methylene blue (n = 3). For each molecule, the chosen concentration was the lowest tested dose at which growth of either ∆actR or ∆soxR was statistically significantly different from WT. C) Diameter of growth inhibition zone around a disk infused with 10% SDS, 2 M HCl, or 5.5 M H2O2 (n ≥ 6). The measurements represent the diameter of the zone of clearing minus the diameter of the disk itself. D) Growth of WT, ∆actR, and ∆soxR on agar plates containing either plain LB or a concentration gradient (low-high, left to right) of bile salts (up to 2%). Images are representative of eight biological replicates. In A and B, cultures were in stationary phase at the reported time point. In B and C, * p < 0.05, ** p < 0.01, *** p < 0.001 (in B, linear regression with dummy variable coding using WT as the reference group; in C, Kruskal-Wallis test followed by pairwise Wilcox rank sum test with the Benjamini-Hochberg procedure for controlling the false discovery rate). Error bars in A-C represent standard deviations of biological replicates.
Fig. 3
Fig. 3
SoxR protects A. tumefaciens against PYO by upregulating functionally redundant superoxide dismutase, transporters and redox-related genes. A) qRT-PCR validation of putative members of the SoxR regulon, showing that induction of these genes upon a 20 min exposure to 100 µM PYO was partially or fully abrogated in the ∆SoxR mutant (n = 3). Bolded genes lack a SoxR box and thus could not be identified as SoxR-regulated by computational approaches in earlier studies. qRT-PCR validation was not performed for Atu4581 and Atu4582, as these genes are predicted to be co-transcribed with sodBII (Mao et al., 2009). Expression levels were normalized to the housekeeping gene rpoD, and induction was calculated as the expression in the presence of PYO divided by the expression without PYO. B) Growth of single knockout mutants for members of the SoxR regulon after 24 hrs in the presence of 200 µM PYO, normalized to growth of parallel cultures without PYO. ** p < 0.01, *** p < 0.001 (n = 3, linear regression with dummy variable coding using WT as the reference group). C) Normalized expression levels of sodBII and soxR in WT after 20 min exposure to different concentrations of PYO (n = 3). Expression levels were determined by qRT-PCR and normalized to rpoD. D) Growth of WT, ∆sodBI, ∆sodBII, ∆soxR, and the ∆sodBI/sodBII and ∆soxR/∆sodBI mutants after 24 hrs in the presence of different concentrations of PYO (n ≥ 3). Error bars in all panels represent standard deviations of biological replicates. In B and D, cultures were in stationary phase at the reported time point.
Fig. 4
Fig. 4
Expression of cytochrome o oxidase and cytochrome d oxidase is dysregulated in ∆actR. A) Plot of the absolute values of log2 fold changes in gene expression upon 100 µM PYO treatment in WT against absolute values of log2 fold changes in gene expression upon 100 µM PYO treatment in ∆actR. Only genes that were statistically significantly differentially expressed (adjusted p-value < 0.01) upon PYO treatment in at least one strain are plotted. Each point represents a single gene. The black line is y = x. B) Volcano plots of RNA-seq data comparing gene expression levels in ∆actR to WT, with either 0 µM PYO or 100 µM PYO. The vertical dashed lines mark a log2 fold change of −2 or 2, and the horizontal dashed line marks an adjusted p-value of 0.01. Only genes with statistical significance below the adjusted p-value cutoff are plotted. C) qRT-PCR data confirming the expression patterns of the cyo and cyd operons in ∆actR vs. WT. The + PYO condition represents treatment with 100 µM PYO. Only cyoA and cydA are shown for brevity, as they are co-transcribed with other members of these operons. Expression levels were normalized to the housekeeping gene rpoD. ** p < 0.01 (Welch’s t-test followed by the Benjamini-Hochberg procedure for controlling the false discovery rate; n = 3). Error bars represent standard deviations of biological replicates.
Fig. 5
Fig. 5
Loss of cytochrome o oxidase, but not overexpression of cytochrome d oxidase, increases sensitivity to PYO. A) Growth of WT, ∆actR, ∆cyo, and ∆actR/∆cyo after 8 hrs (left) or 24 hrs (right) in the presence of different concentrations of PYO. 8 hrs corresponds to late exponential phase while 24 hrs corresponds to stationary phase. B) Growth of WT pLacZ (vector control for overexpression constructs), ∆actR pLacZ, ∆actR pCyo (overexpression construct for the cyo operon), and ∆actR pCyd (overexpression construct for the cyd operon). Overexpression was induced by adding 1 mM IPTG at the start of the experiment. Growth of ∆actR pCyo is statistically significantly higher than growth of ∆actR pLacZ at both time points and across all concentrations of PYO, except for 0 µM and 200 µM PYO after 8 hrs (p < 0.05, Welch’s t-test followed by the Benjamini-Hochberg procedure for controlling the false discovery rate). All data points are plotted with error bars representing standard deviations of biological replicates (n = 3).
Fig. 6
Fig. 6
Loss of ActR decreases cellular ATP levels and increases dependence on SoxR-regulated SodBII. A) Oxygen consumption rates of exponential-phase WT and ∆actR with and without 10 µM PYO (n = 3). B) Simplified cartoon showing the relationship between Cyo, Cyd, and ATP synthase, as well as the different coupling constants of Cyo and Cyd (2H+/e- vs. 1H+/e-, respectively). QH2 = ubiquinol (reduced), Q = ubiquinone (oxidized). C) Bulk ATP levels in exponential phase cultures of WT, ∆actR, and ∆cyoABCD, with and without 10 µM PYO. * p < 0.05, * p < 0.01 (Welch’s t-test followed by the Benjamini-Hochberg procedure for controlling the false discovery rate; n = 3). D) Growth of WT, ∆sodBII, ∆actR, and ∆actR/∆sodBII after 24 hrs in the presence of different concentrations of PYO, showing the increased dependency of ∆actR on SodBII (n ≥ 3). Cultures were in stationary phase at this time point. Data for WT and ∆actR are from Fig. 2A. Error bars in A, B, and D represent standard deviations of biological replicates.
Fig. 7
Fig. 7
Proposed model for regulation of phenazine tolerance in A. tumefaciens. Phenazine tolerance is regulated in both a constitutive (ActR-mediated) and inducible (SoxR-mediated) manner. ActR promotes phenazine tolerance in part by upregulating expression of cytochrome o oxidase (Cyo) at the expense of cytochrome d oxidase (Cyd) during aerobic growth. Cyo is more efficient at powering ATP synthesis and thereby supports energy-dependent defense and repair mechanisms. Levels of Cyo and Cyd may also affect how readily phenazines “steal” electrons from the electron transport chain and generate toxic superoxide radicals. Phenazines can directly oxidize and thereby activate SoxR. Activation of the SoxR regulon is likely energy dependent due to massive upregulation of several proteins, including superoxide dismutase (Sod), at least five efflux pumps, redox-related proteins such as ferredoxin, and other proteins that are as yet uncharacterized. The SoxR-regulated Sod becomes more important in the absence of ActR. Phzox = oxidized phenazines, Phzred = reduced phenazines.

Similar articles

Cited by

References

    1. Alonso A, Rojo F, and Martínez JL (1999) Environmental and clinical isolates of Pseudomonas aeruginosa show pathogenic and biodegradative properties irrespective of their origin. Environ Microbiol 1: 421–430. - PubMed
    1. Alvarez AF, Malpica R, Contreras M, Escamilla E, and Georgellis D (2010) Cytochrome d but not cytochrome o rescues the toluidine blue growth sensitivity of arc mutants of Escherichia coli. J Bacteriol 192: 391–399. - PMC - PubMed
    1. An D, Danhorn T, Fuqua C, and Parsek MR (2006) Quorum sensing and motility mediate interactions between Pseudomonas aeruginosa and Agrobacterium tumefaciens in biofilm cocultures. Proc Natl Acad Sci 103: 3828–3833. - PMC - PubMed
    1. Audenaert K, Pattery T, Cornelis P, and Höfte M (2002) Induction of systemic resistance to Botrytis cinerea in tomato by Pseudomonas aeruginosa 7NSK2: role of salicylic acid, pyochelin, and pyocyanin. Mol Plant-Microbe Interact 15: 1147–1156. - PubMed
    1. Baek SH, Hartsock A, and Shapleigh JP (2008) Agrobacterium tumefaciens C58 uses ActR and FnrN to control nirK and nor expression. J Bacteriol 190: 78–86. - PMC - PubMed

Publication types

MeSH terms