. 2019 Oct;15(10):1757-1773.
doi: 10.1080/15548627.2019.1596477. Epub 2019 Apr 19.

Proteasome dysfunction induces excessive proteome instability and loss of mitostasis that can be mitigated by enhancing mitochondrial fusion or autophagy

Affiliations

Proteasome dysfunction induces excessive proteome instability and loss of mitostasis that can be mitigated by enhancing mitochondrial fusion or autophagy

Eleni N Tsakiri et al. Autophagy. 2019 Oct.

Abstract

The ubiquitin-proteasome pathway (UPP) is central to proteostasis network (PN) functionality and proteome quality control. Yet, the functional implication of the UPP in tissue homeodynamics at the whole organism level and its potential cross-talk with other proteostatic or mitostatic modules are not well understood. We show here that knock down (KD) of proteasome subunits in Drosophila flies, induced, for most subunits, developmental lethality. Ubiquitous or tissue specific proteasome dysfunction triggered systemic proteome instability and activation of PN modules, including macroautophagy/autophagy, molecular chaperones and the antioxidant cncC (the fly ortholog of NFE2L2/Nrf2) pathway. Also, proteasome KD increased genomic instability, altered metabolic pathways and severely disrupted mitochondrial functionality, triggering a cncC-dependent upregulation of mitostatic genes and enhanced rates of mitophagy. Whereas, overexpression of key regulators of antioxidant responses (e.g., cncC or foxo) could not suppress the deleterious effects of proteasome dysfunction; these were alleviated in both larvae and adult flies by modulating mitochondrial dynamics towards increased fusion or by enhancing autophagy. Our findings reveal the extensive functional wiring of genomic, proteostatic and mitostatic modules in higher metazoans. Also, they support the notion that age-related increase of proteotoxic stress due to decreased UPP activity deregulates all aspects of cellular functionality being thus a driving force for most age-related diseases. Abbreviations: ALP: autophagy-lysosome pathway; ARE: antioxidant response element; Atg8a: autophagy-related 8a; ATPsynβ: ATP synthase, β subunit; C-L: caspase-like proteasomal activity; cncC: cap-n-collar isoform-C; CT-L: chymotrypsin-like proteasomal activity; Drp1: dynamin related protein 1; ER: endoplasmic reticulum; foxo: forkhead box, sub-group O; GLU: glucose; GFP: green fluorescent protein; GLY: glycogen; Hsf: heat shock factor; Hsp: Heat shock protein; Keap1: kelch-like ECH-associated protein 1; Marf: mitochondrial assembly regulatory factor; NFE2L2/Nrf2: nuclear factor, erythroid 2 like 2; Opa1: optic atrophy 1; PN: proteostasis network; RNAi: RNA interference; ROS: reactive oxygen species; ref(2)P: refractory to sigma P; SQSTM1: sequestosome 1; SdhA: succinate dehydrogenase, subunit A; T-L: trypsin-like proteasomal activity; TREH: trehalose; UAS: upstream activation sequence; Ub: ubiquitin; UPR: unfolded protein response; UPP: ubiquitin-proteasome pathway.

Keywords: Aging; autophagy; cncC; foxo; mitostasis; proteasome; proteostasis.


Figures
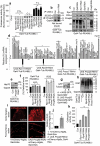
Figure 1.
Figure 1.
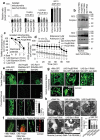
RNAi-mediated KD of 20S or 19S proteasomal subunits disrupts proteasome functionality resulting in proteome instability and the activation of PN modules. (a) Relative (%) 26S proteasome activities (vs. control) after KD of the shown proteasomal subunits. (b) Immunoblot analyses after immunoprecipitation of shown tissue lysates with a 20S-α antibody and probing with antibodies against Prosβ5 and 20S proteasome subunit α (20S-α). (c) Immunoblot analyses (after KD of the indicated proteasomal subunits) of tissue protein samples probed with antibodies against proteasomal subunits Rpn7, 20S-α, Prosβ5 and ubiquitin (Ub). (d) Relative expression (vs. control) of Prosβ5, Prosβ2, Prosβ1, Prosα4, Prosα7, Rtp6, Rpn6, Rpn11, cncC, Keap1, Trxr-1, Atg8a, Atg6, Hsf and Hsp70 genes following KD of the shown proteasomal subunits. (e) Immunoblot showing Hsp70 expression after KD of the Prosβ5 proteasomal subunit. (f) Relative (%) H2O2 and ROS levels in mitochondria and in larvae tissues respectively, after KD of the shown proteasomal subunits. (g) Immunoblot showing GFP expression in the GstD1-ARE:GFP/II reporter line after KD of the Prosβ5 proteasomal gene. (h) Immunoblot analyses of total protein carbonylation (dinitrophenol, DNP) in flies’ tissues after Rpn6, Prosβ5 and Prosα7 KD. (i) CLSM visualization of the mCherry-Atg8a and (j) quantification (vs. control) of mCherry-Atg8a dots in the nervous tissues of larvae expressing Prosβ5 RNAi. (k) Relative (%) cathepsin activities (CtsB1/CTSB, Cp1/CTSL) in larvae tissues of the indicated genotypes. In all cases (unless otherwise indicated) data refer to 3rd instar stage transgenic larvae not exposed to RU486 (driver, Gal4-Tub). Controls refer to larvae expressing mCherry RNAi. Gene expression was plotted vs. the respective control set to 1; in (a, f, k) control values were set to 100%. Gapdh (b, c, e, h) or Tubulin (g) probing and RpL32/rp49 gene expression (d) were used as input reference. Bars, ± SD; n ≥ 2; *P < 0.05; **P < 0.01.
Figure 2.
Figure 2.
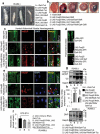
Sustained decline of proteasome activities results in severe disruption of mitostasis. (a) Relative mitochondrial ST3:ST4, FCCP:ST4 and ADP:ST3 ratios or actual ST2 values after KD of the shown proteasomal subunits. (b) Immunoblots after BN-PAGE (1% Triton X-100) for the analysis of mitochondrial RCS assembly, and probing with antibodies against ND-30/NDUFS3 (complex I) and blw/ATP5F1A (complex V); mitochondria were isolated from larvae tissues expressing Prosβ5, Prosα7 or Rpn11 RNAi transgenes. (c) Relative TMRM fluorescence in isolated mitochondria from larvae of the shown genotypes after the addition of 1 μM oligomycin for 15, 30 min or 1 μM FCCP. (d) In vivo O2 consumption (Seahorse apparatus) in larvae expressing Prosβ5 or Prosα7 RNAi transgenes; the time point of rotenone and antimycin addition is indicated by an arrow. (e) CLSM visualization of mitochondria (Mito-GFP reporter) in the nervous system of larvae after KD of the Prosβ5 or Rpn11 genes; quantification of visible mitochondria in proximal nervous sections is shown in lower right graph. (f) Representative CLSM images of oxidized mitochondria (red color; Mito-TIMER reporter) after targeted Prosβ5 RNAi in larvae nervous system. Labels 1, 2, 3 in (e) refer to genotypes +/Mito-GFP, Gal4-D42; UAS Prosβ5 RNAi/Mito-GFP, Gal4-D42 and UAS Rpn11 RNAi/Mito-GFP, Gal4-D42 respectively, while in (f) labels 1, 2 refer to genotypes +/Mito-TIMER, Gal4-Elav and UAS Prosβ5 RNAi/Mito-TIMER, Gal4-Elav respectively. (g, h) CLSM (g) or EM (h) visualization of mitochondria in larvae muscle after KD of the shown proteasome subunits; in (g) nuclei (n) and perinuclear mitochondrial aggregates (arrows) are indicated, while in (h), stars indicate electron dense areas in mitochondria, and arrows disrupted mitochondrial cristae and outer membranes. Labels 1, 2 in (g) refer to genotypes +/Mito-GFP, Gal4-Mef2 and UAS Prosβ5 RNAi/Mito-GFP, Gal4-Mef2 respectively. Lower right panel in (h) indicates quantification of mean mitochondrial length. Unless otherwise indicated data refer to 3rd instar stage larvae not treated with RU486 (driver, Gal4-Tub). Controls referred to larvae expressing mCherry RNAi. In (c) control values were set to 100%. Hsc70-5 (HSPA9/Grp75) (b) probing was used as input reference. Bars, ± SD; n ≥ 2; *P < 0.05; **P < 0.01.
Figure 3.
Figure 3.
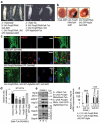
Increased expression of Pink1 and park genes and of mitophagy after KD of the β5 proteasomal subunit. (a) Relative expression (vs. control) of Pink1 and park genes following KD of the Prosβ5 proteasomal gene. (b) CLSM visualization of GFP and mCherry signal of the Mito-QC reporter in larval cells after RNAi of the Prosβ5 gene; white arrows indicate mCherry positive staining. The RpL32/rp49 gene expression (a) was used as input reference; n, nucleus. Bars, ± SD; n ≥ 2; *P < 0.05.
Figure 4.
Figure 4.
Enhanced mitochondrial fusion partially rescued mitostasis albeit with no enhanced proteome stability. (a) Stereoscope viewing of 3rd instar control (+/Gal4-Tub) or transgenic larvae expressing the indicated transgenes. (b) Stereoscope viewing of control adult flies’ eyes (+/Gal4-GMR) or after targeted eye expression of the indicated transgenes. (c, d) CLSM viewing of Mito-GFP reporter along with immunofluorescence staining of tissues with a ref(2)P antibody and DAPI, in muscle (c) or nervous tissues (d; only Mito-GFP is shown) after KD of Prosβ5 or both the Prosβ5 and Marf genes. (e) CLSM visualization of Mito-GFP reporter in muscles of the shown transgenic larvae stained also for ref(2)P and counterstained with DAPI. (f) Relative mitochondrial ST3:ST4 ratio in tissues of the shown transgenic larvae. (g, i) Immunoblotting analyses of tissues protein samples from indicated transgenic larvae; samples were probed with antibodies against ref(2)P, Hsp70, ubiquitinated (Ub) (g) and carbonylated (DNP) (i) proteins. (h) Relative expression (vs. control) of Hsp70 and ref(2)P genes in 3rd instar control (+/Gal4-Tub) or transgenic larvae expressing the shown transgenes. If not otherwise indicated, data refer to 3rd instar stage larvae not exposed to RU486 (driver, Gal4-Tub). Arrows in (c), (e) indicate ref(2)P colocalization with aggregated mitochondria. Gapdh (g, i) probing was used as input reference. Bars, ± SD; n ≥ 2; *P < 0.05; **P < 0.01.
Figure 5.
Figure 5.
Enhancement of mitochondrial fusion mitigates loss of proteasome function effects on mitochondria. (a) CLSM viewing of Mito-GFP reporter in muscle tissues of shown genotypes. (b, c) CLSM viewing of Mito-GFP and Mito-TIMER reporters (b), along with quantification of green (not oxidized):red (oxidized) Mito-TIMER ratio (c) after targeted expression of the shown transgenes in larvae nervous system. (d) Longevity curves of flies overexpressing the shown transgenes. Statistics of the longevity curves are reported in Table S1. Bars, ± SD; n ≥ 2; *P < 0.05.
Figure 6.
Figure 6.
Enhancing the expression of autophagic effectors (Atg8a) alleviates the proteasome dysfunction-induced loss of mitostasis and proteome instability. (a) Stereoscope viewing of 3rd instar control (+/Gal4-Mef2, +/Gal4-Tub) or transgenic larvae expressing the shown transgenes in muscles (Gal4-Mef2 driver) or ubiquitously (Gal4-Tub inducible driver). (b) Stereoscope viewing of adult transgenic flies’ eyes after eye-targeted Prosβ5 RNAi or combined Prosβ5 and GFP-Atg8a OE. (c) CLSM viewing of Mito-GFP reporter and of GFP-Atg8a, along with immunofluorescence staining of muscles tissues with a ref(2)P antibody and DAPI in shown transgenic larvae. (d) ST3:ST4 mitochondrial ratio in tissues of shown transgenic larvae. (e) Immunoblotting analyses of tissue protein samples from shown transgenic larvae; samples were probed with antibodies against Rpn6, 20S-α, ref(2)P, Hsp70, ubiquitinated (Ub) and carbonylated (DNP) proteins. (f) Relative expression (vs. control) of the Hsp70 gene in larvae or adult flies expressing the shown transgenes. Mhc, muscle specific driver; mRNA expression levels were assayed in dissected head (enriched in neural tissues) and thorax (enriched in muscle tissues) samples. Unless otherwise indicated, data refer to 3rd instar stage larvae not exposed to RU486 (driver, Gal4-Tub). Arrows in (c, lower panel) denote lysosome-like structures positive for GFP that colocalize with ref(2)P. Gapdh (e) probing was used as input reference. Bars, ± SD; n ≥ 2; **P < 0.01.
Figure 7.
Figure 7.
Atg8a OE in adult flies suppresses the toxic effects of proteasome KD and increases adult flies’ longevity. (a) Immunoblotting analyses of protein samples from shown transgenic flies somatic tissues; samples were probed with antibodies against GFP (denotes expression of the GFP-Atg8a transgene), ubiquitinated (Ub) and carbonylated (DNP) proteins. (b) Immunoblotting analyses of protein samples from shown transgenic flies somatic tissues; samples were probed with antibodies against ubiquitinated (Ub) and carbonylated (DNP) proteins. (c) Longevity curves of indicated transgenic fly lines. Statistics of the shown longevity curves are reported in Table S1. In (a) young flies were exposed to RU486 for 3 days and were then treated (or not) with RU486/1 μΜ PS-341 for 4 days, while in (b) young flies were exposed to RU486 for 7 days. Gapdh (a, b) probing was used as input reference.

Similar articles

Cited by

References

    1. Trougakos IP, Sesti F, Tsakiri E, et al. Non-enzymatic post-translational protein modifications and proteostasis network deregulation in carcinogenesis. J Proteomics. 2013;92:274–298. - PubMed
    1. Labbadia J, Morimoto RI.. The biology of proteostasis in aging and disease. Annu Rev Biochem. 2015;84:435–464. - PMC - PubMed
    1. Taylor RC, Dillin A. Aging as an event of proteostasis collapse. Cold Spring Harb Perspect Biol. 2011;1(5):3. - PMC - PubMed
    1. Kaushik S, Cuervo AM. Proteostasis and aging. Nat Med. 2015;21:1406–1415. - PubMed
    1. Sykiotis GP, Bohmann D. Stress-activated cap‘n‘collar transcription factors in aging and human disease. Sci Signal. 2010;3:re3. - PMC - PubMed

Publication types

MeSH terms

LinkOut - more resources