

Kinetics-Based Measurement of Hypoxia in Living Cells and Animals Using an Acetoxymethyl Ester Chemiluminescent Probe
- PMID: 31002225
- PMCID: PMC6633910
- DOI: 10.1021/acssensors.9b00360
Kinetics-Based Measurement of Hypoxia in Living Cells and Animals Using an Acetoxymethyl Ester Chemiluminescent Probe
Abstract
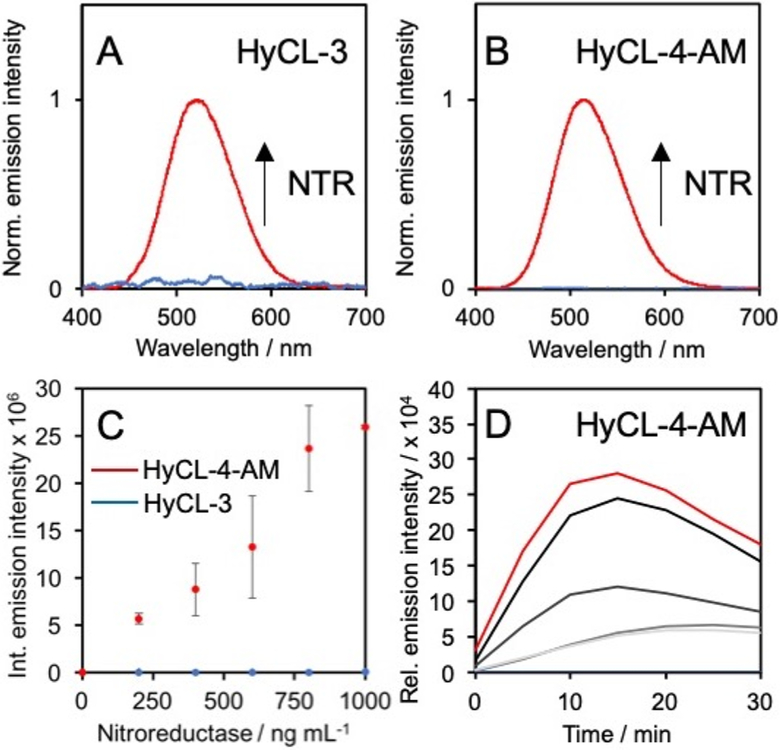
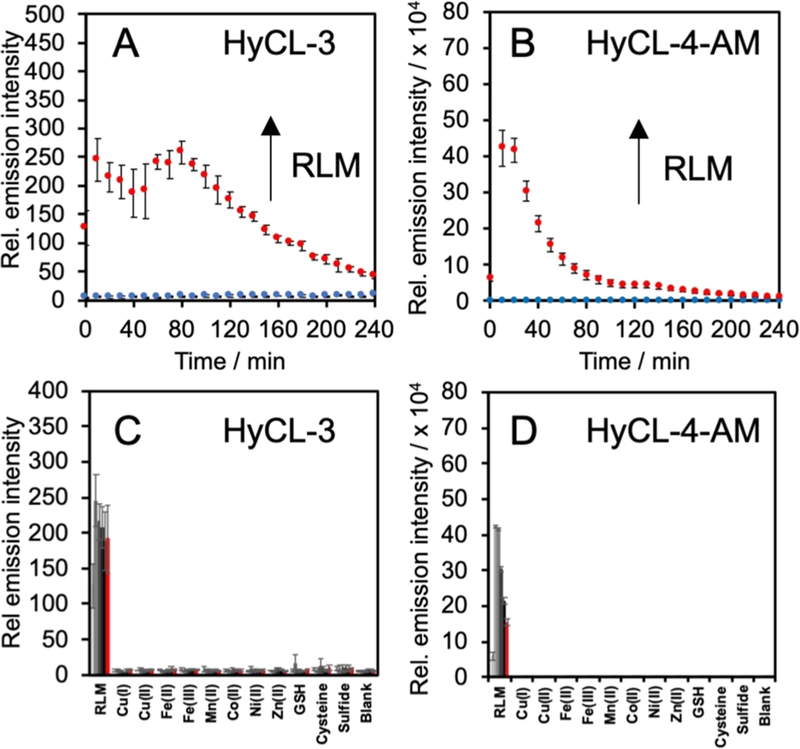
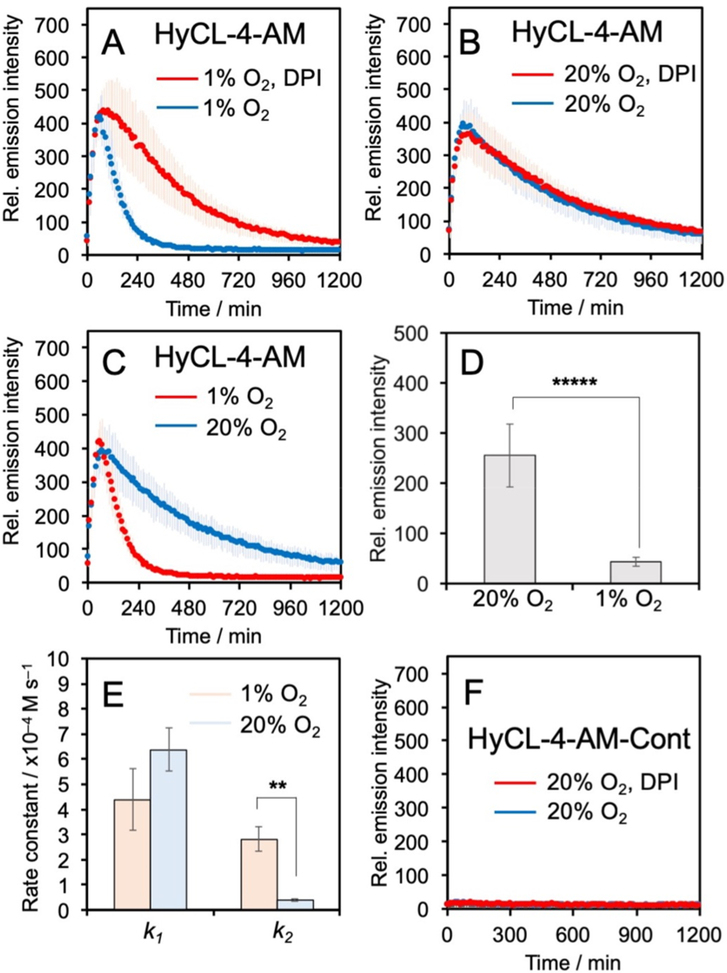
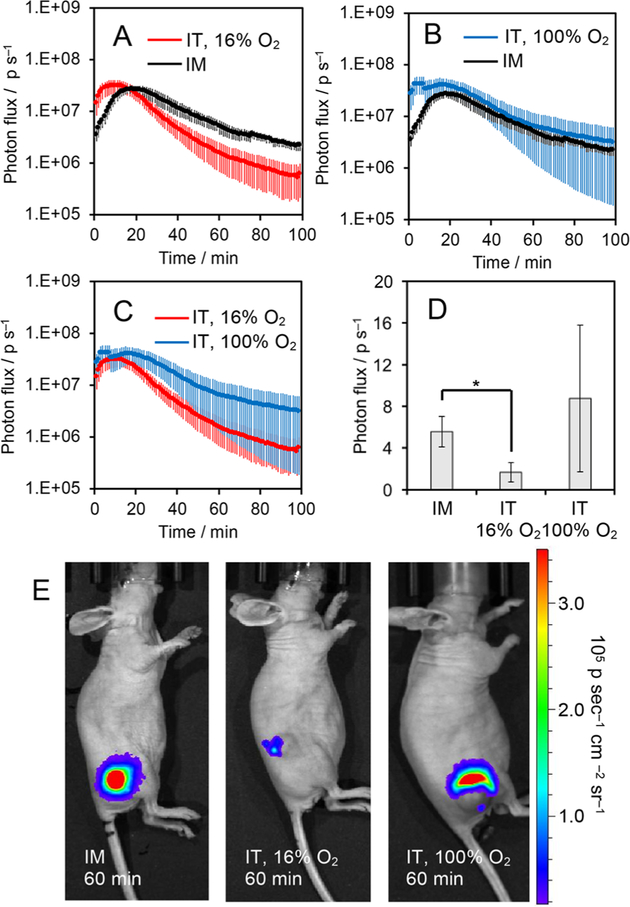
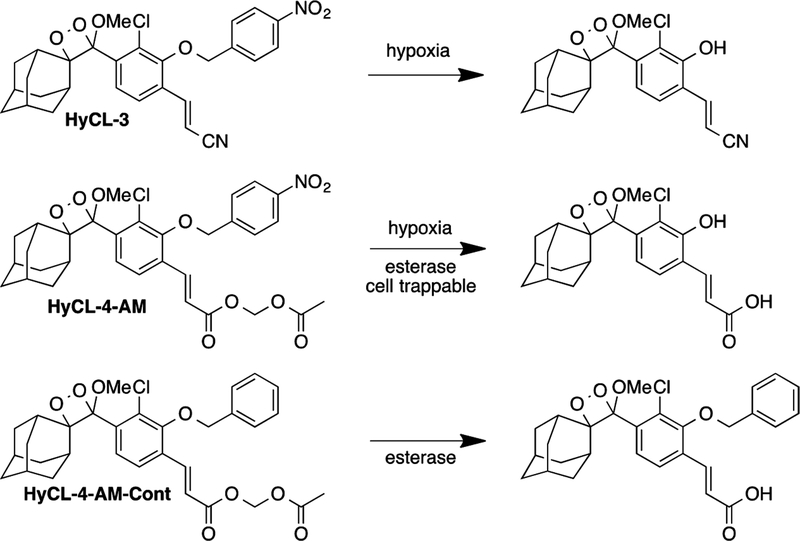
Oxygenation and tissue hypoxia play critical roles in mammalian biology and contribute to aggressive phenotypes in cancerous tumors, driving research to develop accurate and easy-to-implement methods for monitoring hypoxia in living cells and animal models. This study reports the chemiluminescent probe HyCL-4-AM, which contains a nitroaromatic sensing moiety and, importantly, an acetoxymethyl (AM) ester that dramatically improves operation in cells and animals. HyCL-4-AM provides a selective 60 000-fold increase in luminescence emission in the presence of rat liver microsomes (RLM). For cellular operation, the chemiluminescence response kinetics is sharply dependent on oxygen levels, enabling highly significant and reproducible measurement of hypoxia in living cells. Whole animal imaging experiments in muscle tissue and tumor xenografts show that HyCL-4-AM can differentiate between well oxygenated muscle tissue and hypoxic tumors, demonstrating potential for monitoring tumor reoxygenation via hyperoxic treatment.
Keywords: 1,2-dioxetanes; chemiluminescence; hypoxia; in vivo imaging; nitroreductase.
Conflict of interest statement
The authors declare the following competing financial interest(s): A.R.L. discloses a financial stake in BioLum Sciences, LLC, a company developing technology for home-monitoring of asthma.
Figures
Similar articles
-
In Vivo Chemiluminescent Imaging Agents for Nitroreductase and Tissue Oxygenation.Anal Chem. 2016 May 3;88(9):4995-5002. doi: 10.1021/acs.analchem.6b01096. Epub 2016 Apr 15. Anal Chem. 2016. PMID: 27054463 Free PMC article.
-
A Highly Sensitive Chemiluminescent Probe for Detecting Nitroreductase and Imaging in Living Animals.Anal Chem. 2019 Jan 15;91(2):1384-1390. doi: 10.1021/acs.analchem.8b03955. Epub 2019 Jan 4. Anal Chem. 2019. PMID: 30582678
-
Seeking Illumination: The Path to Chemiluminescent 1,2-Dioxetanes for Quantitative Measurements and In Vivo Imaging.Acc Chem Res. 2021 Jul 6;54(13):2844-2857. doi: 10.1021/acs.accounts.1c00185. Epub 2021 Jun 10. Acc Chem Res. 2021. PMID: 34110136 Free PMC article.
-
Preclinical development and current status of the fluorinated 2-nitroimidazole hypoxia probe N-(2-hydroxy-3,3,3-trifluoropropyl)-2-(2-nitro-1-imidazolyl) acetamide (SR 4554, CRC 94/17): a non-invasive diagnostic probe for the measurement of tumor hypoxia by magnetic resonance spectroscopy and imaging, and by positron emission tomography.Anticancer Drug Des. 1998 Sep;13(6):703-30. Anticancer Drug Des. 1998. PMID: 9755726 Review.
-
Exploring the Structural Space of Chemiluminescent 1,2-Dioxetanes.ACS Sens. 2023 Jan 27;8(1):3-11. doi: 10.1021/acssensors.2c02371. Epub 2022 Dec 27. ACS Sens. 2023. PMID: 36574491 Review.
Cited by
-
Dark Dynamic Therapy: Photosensitization without Light Excitation Using Chemiluminescence Resonance Energy Transfer in a Dioxetane-Erythrosin B Conjugate.ACS Chem Biol. 2022 May 20;17(5):1082-1091. doi: 10.1021/acschembio.1c00925. Epub 2022 Apr 8. ACS Chem Biol. 2022. PMID: 35394740 Free PMC article.
-
Chemiluminescence in Combination with Organic Photosensitizers: Beyond the Light Penetration Depth Limit of Photodynamic Therapy.Int J Mol Sci. 2022 Oct 19;23(20):12556. doi: 10.3390/ijms232012556. Int J Mol Sci. 2022. PMID: 36293406 Free PMC article. Review.
-
Modular Access to Diverse Chemiluminescent Dioxetane-Luminophores through Convergent Synthesis.Angew Chem Int Ed Engl. 2022 May 23;61(22):e202202187. doi: 10.1002/anie.202202187. Epub 2022 Mar 29. Angew Chem Int Ed Engl. 2022. PMID: 35258138 Free PMC article.
-
Chemiluminescent 1,2-Dioxetane Iridium Complexes for Near-Infrared Oxygen Sensing.Angew Chem Int Ed Engl. 2022 Mar 14;61(12):e202115704. doi: 10.1002/anie.202115704. Epub 2022 Jan 27. Angew Chem Int Ed Engl. 2022. PMID: 35037345 Free PMC article.
-
Chemiluminescence Measurement of Reactive Sulfur and Nitrogen Species.Antioxid Redox Signal. 2022 Feb;36(4-6):337-353. doi: 10.1089/ars.2021.0195. Epub 2021 Oct 22. Antioxid Redox Signal. 2022. PMID: 34514838 Free PMC article. Review.
References
-
- Aragonés J; Fraisl P; Baes M; Carmeliet P Oxygen sensors at the crossroad of metabolism. Cell Metab 2009, 9, 11–22. - PubMed
-
- Pennacchietti S; Michieli P; Galluzzo M; Mazzone M; Giordano S; Comoglio PM Hypoxia promotes invasive growth by transcriptional activation of the met protooncogene. Cancer Cell 2003, 3, 347–361. - PubMed
-
- Sullivan R; Graham CH Hypoxia-driven selection of the metastatic phenotype. Cancer Metastasis Rev 2007, 26, 319–331. - PubMed
-
- Sendoel A; Hengartner MO Apoptotic cell death under hypoxia. Physiology 2014, 29, 168–176. - PubMed
Publication types
MeSH terms
Substances
Grants and funding
LinkOut - more resources
Full Text Sources
