. 2019 May 9;70(10):2727-2740.
doi: 10.1093/jxb/erz098.

Tomato fruit ripening factor NOR controls leaf senescence

Affiliations

Tomato fruit ripening factor NOR controls leaf senescence

Xuemin Ma et al. J Exp Bot. .

Abstract

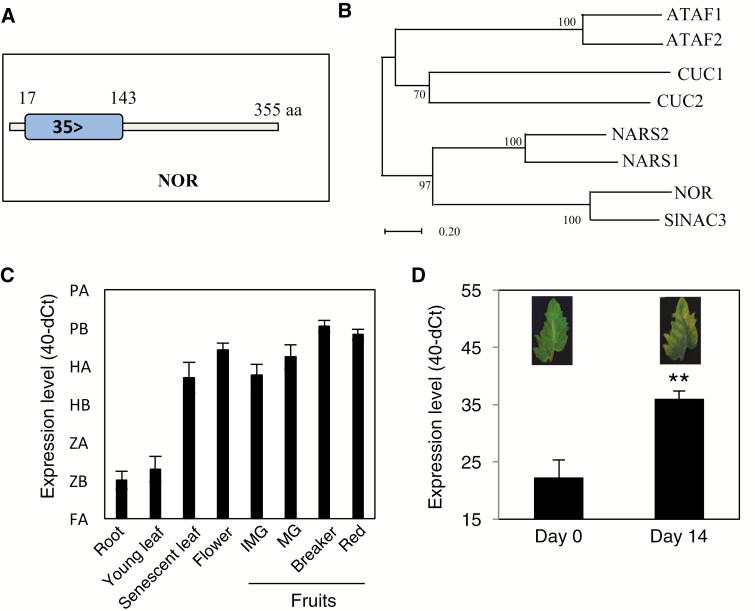
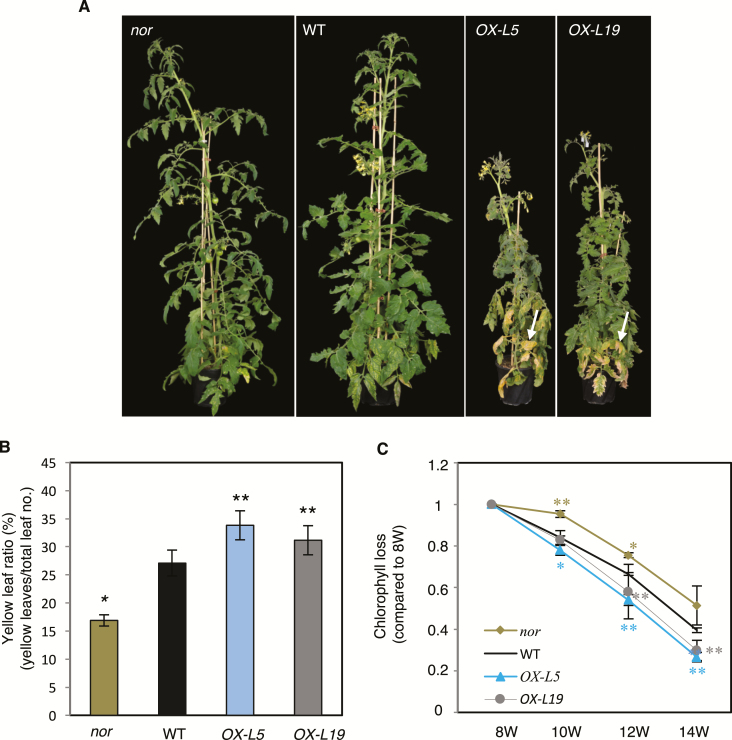
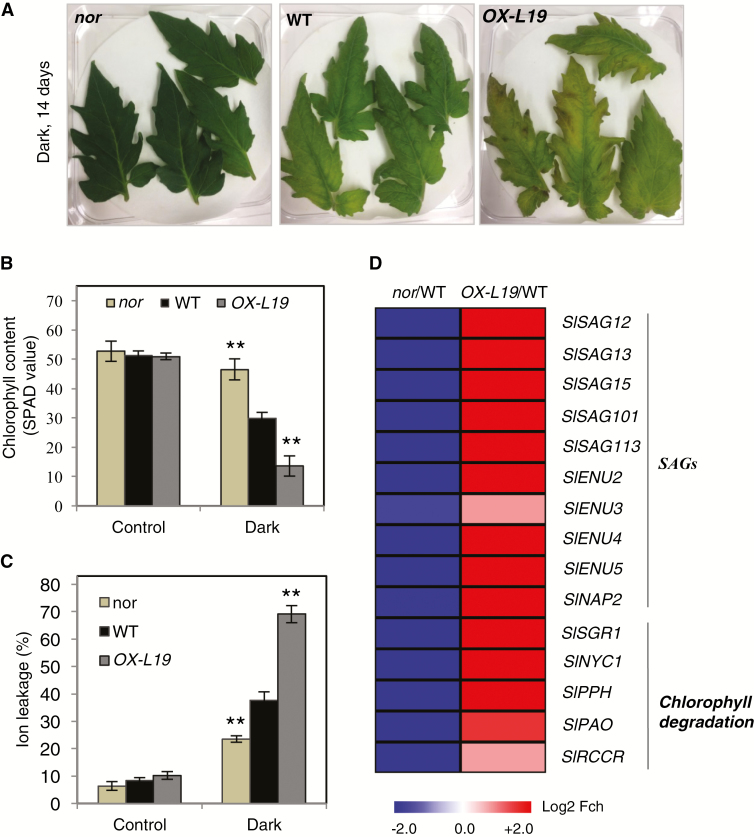
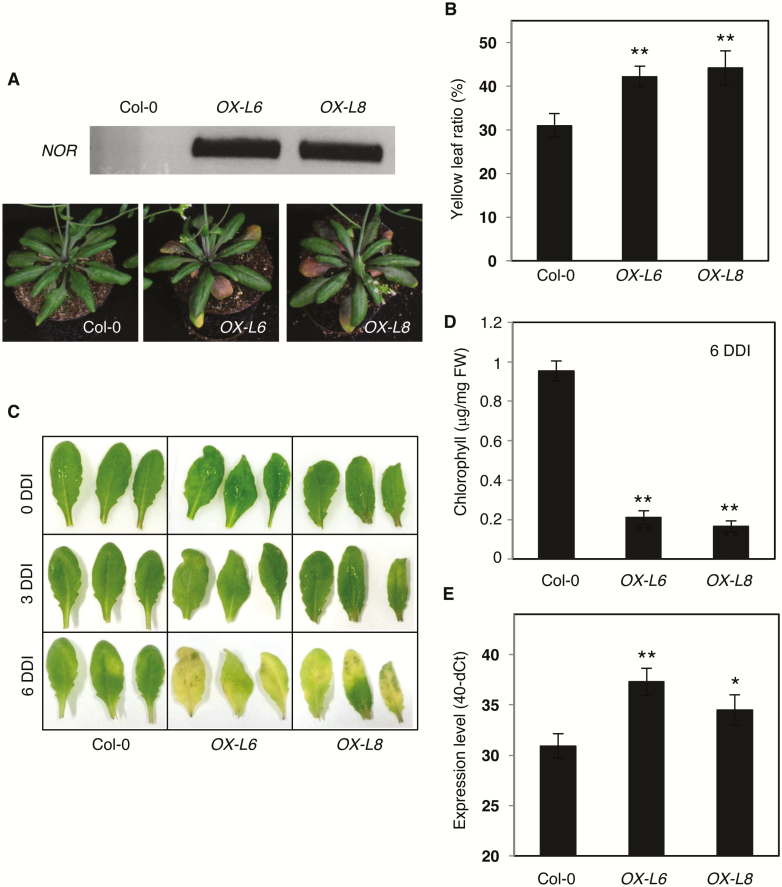
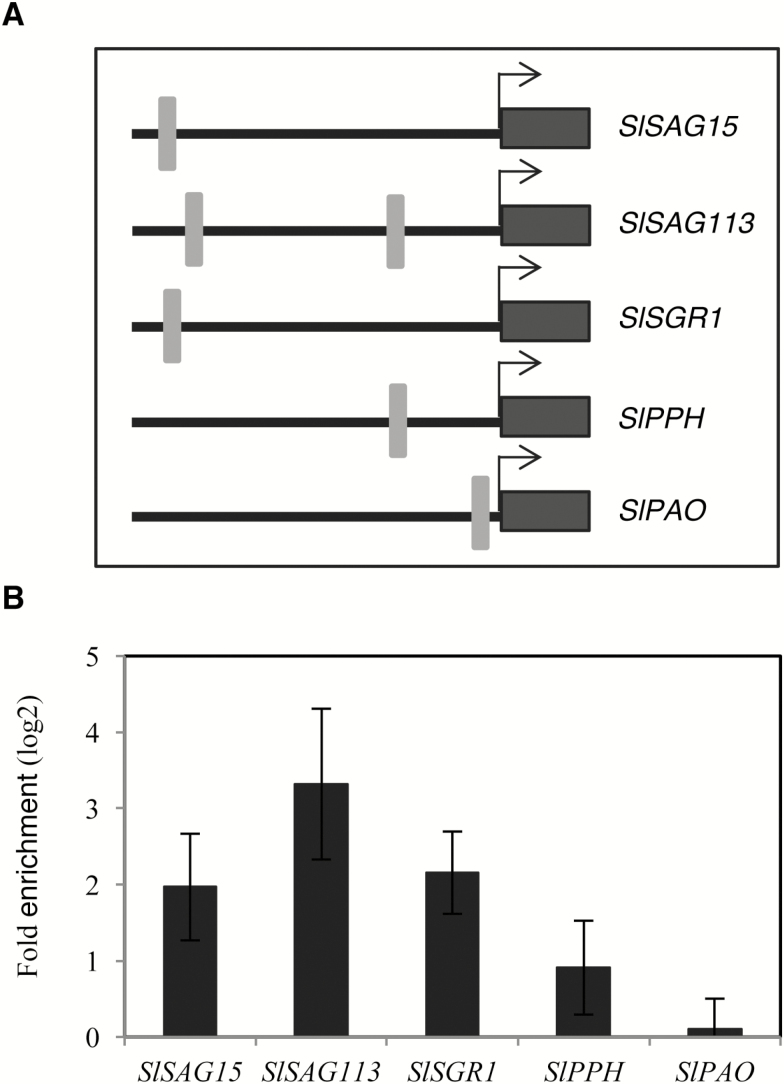
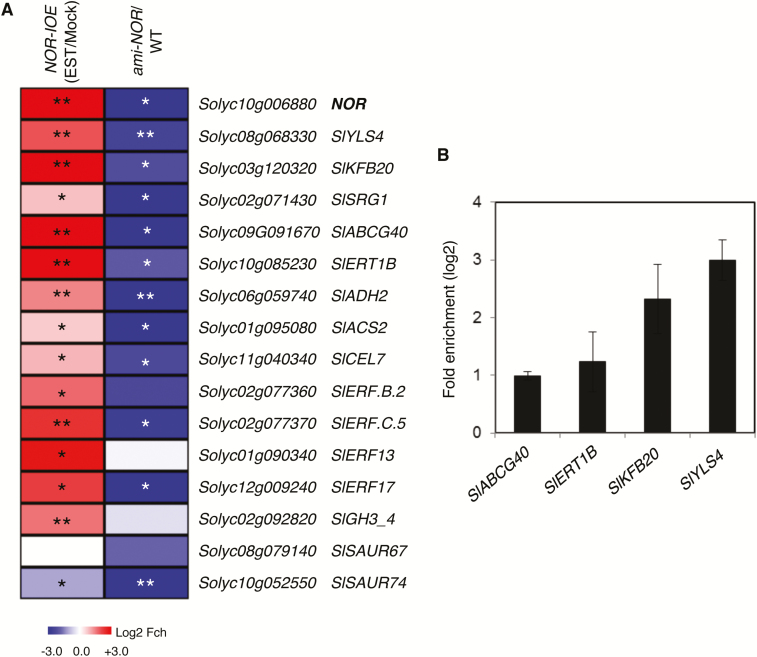
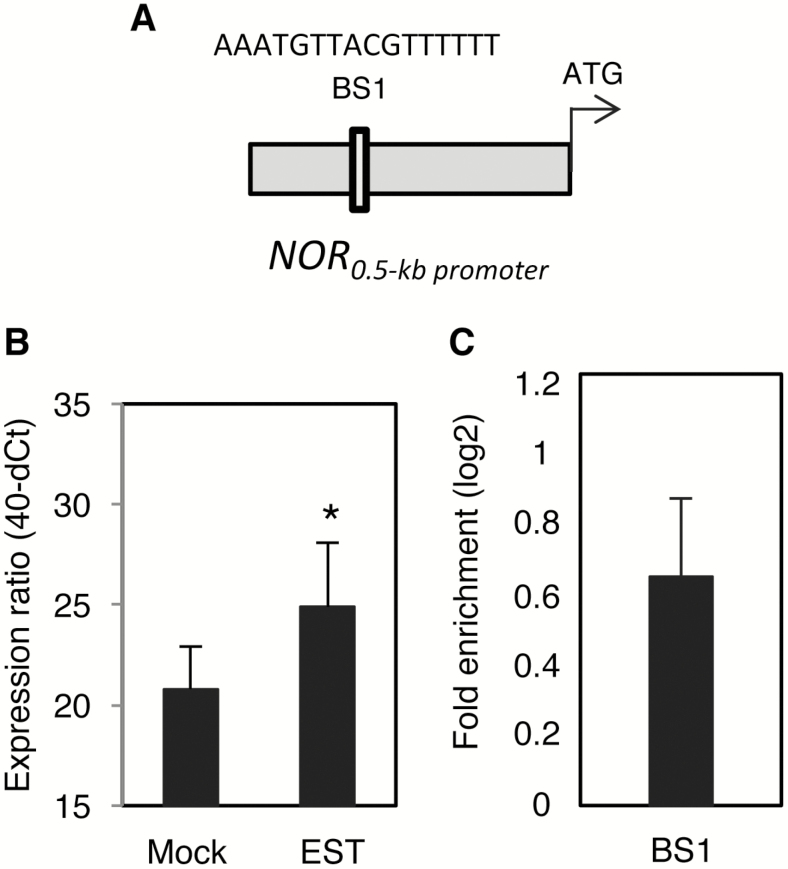
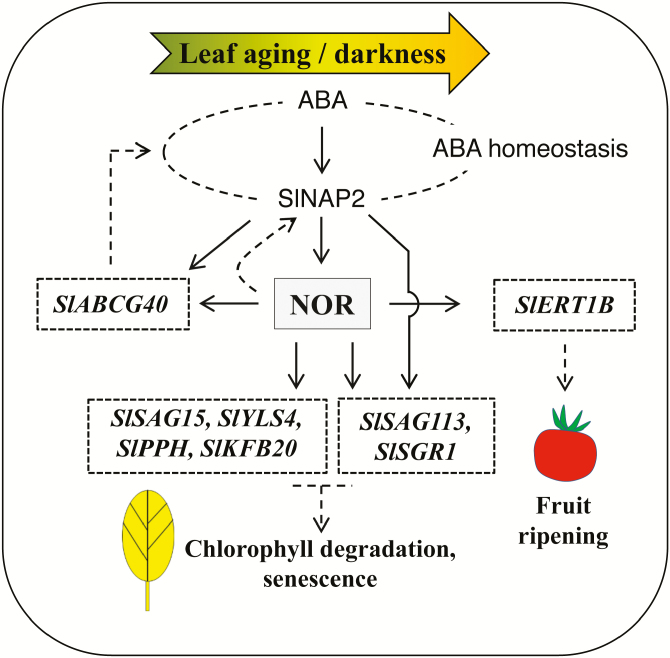
NAC transcription factors (TFs) are important regulators of expressional reprogramming during plant development, stress responses, and leaf senescence. NAC TFs also play important roles in fruit ripening. In tomato (Solanum lycopersicum), one of the best characterized NACs involved in fruit ripening is NON-RIPENING (NOR), and the non-ripening (nor) mutation has been widely used to extend fruit shelf life in elite varieties. Here, we show that NOR additionally controls leaf senescence. Expression of NOR increases with leaf age, and developmental as well as dark-induced senescence are delayed in the nor mutant, while overexpression of NOR promotes leaf senescence. Genes associated with chlorophyll degradation as well as senescence-associated genes (SAGs) show reduced and elevated expression, respectively, in nor mutants and NOR overexpressors. Overexpression of NOR also stimulates leaf senescence in Arabidopsis thaliana. In tomato, NOR supports senescence by directly and positively regulating the expression of several senescence-associated genes including, besides others, SlSAG15 and SlSAG113, SlSGR1, and SlYLS4. Finally, we find that another senescence control NAC TF, namely SlNAP2, acts upstream of NOR to regulate its expression. Our data support a model whereby NAC TFs have often been recruited by higher plants for both the control of leaf senescence and fruit ripening.

Keywords: Aging; NAC; NOR; leaf; non-ripening; senescence; tomato; transcription factor.


Figures

Fig. 1.
Fig. 1.
Relationship of NOR to other NAC factors and NOR expression during senescence. (A) Schematic presentation of the NAM domain of NOR. Numbers indicate amino acid positions. (B) Phylogenetic analysis of selected NAC proteins. The phylogenetic tree was constructed by MEGA 5.05 software using the Neighbor–Joining method with the following parameters: bootstrap analysis of 1000 replicates, Poisson model, and pairwise deletion. NOR and SlNAC3 are two tomato TFs and the others are from Arabidopsis. Gene codes of the Arabidopsis TFs are: ATAF1, At1g01720; ATAF2, At5g08790; NARS1, At3g15510; NARS2, At1g52880; CUC1, At3g15170; and CUC2, At5g53950. (C) NOR transcript abundance in different tissues of wild-type tomato plants (cv. Moneymaker). The y-axis indicates the expression level (40-dCt). Data are means ±SD of three biological replicates. (D) Expression of NOR in young detached leaves of 8-week-old WT plants before (day 0) and after 14 d of dark treatment. Leaves were excised from the top part of the stem. Data are means ±SD (n=3). Asterisks denote a significant difference from Day 0 (Student’s t-test, **P≤0.01).
Fig. 2.
Fig. 2.
NOR promotes leaf senescence in tomato. (A) Phenotype of 12-week-old nor, WT, OX-L5, and OX-L19 plants. Note the early leaf senescence in NOR overexpressors (white arrows). (B) Yellow leaf ratio of 12-week-old WT, OX-L5, OX-L19, and nor plants. Yellow leaves showing >50% yellowing were counted and divided by the total number of leaves. Data are means ±SD (n=5). (C) Chlorophyll loss of the third true leaf (counted from the bottom of the stem) of 8- (8W), 10- (10W), 12- (12W), and 14-week-old (14W) WT, OX-L5, OX-L19, and nor plants. Chlorophyll content was measured by a SPAD meter and at each time point compared with 8W for each genotype (set to 1). Data are means ±SD of three biological replicates. Asterisks in (B) and (C) indicate significant differences from the WT (Student’s t-test, *P≤0.05; **P≤0.01).
Fig. 3.
Fig. 3.
Dark-induced leaf senescence in NOR-modified plants. (A) Detached leaves of 8-week-old nor, WT, and OX-L19 plants after dark treatment. Young leaves from the top of the stem were detached and subjected to darkness for 14 d (Dark). (B) Chlorophyll content of leaves before darkness (control) and of dark-treated leaves. Chlorophyll content was measured using a SPAD meter. (C) Ion leakage of leaves before (control) and after dark treatment. (D) Heat map showing the fold change (log2) of the expression of SAGs and chlorophyll degradation genes in detached leaves of 8-week-old nor and OX-L19 plants, after dark treatment, compared with the WT. The full data are given in Suppelementary Table S2. In (B) and (C), asterisks indicate significant differences from the WT (Student’s t-test; **P≤0.01).
Fig. 4.
Fig. 4.
Overexpression of NOR in Arabidopsis promotes leaf senescence. (A) Phenotype of Arabidopsis Col-0 wild-type and NOR overexpression plants. The upper panel shows NOR transcript abundance in OX-L6 and OX-L8 plants, determined by end-point PCR; as expected, no NOR transcript is observed in the Arabidopsis WT. The lower panel shows the phenotype of 5-week-old plants (Col-0 and NOR overexpressors). (B) Yellow leaf ratio of 5-week-old Col-0, OX-L6, and OX-L8 plants. Yellow leaves showing >50% yellowing were counted and compared with the total leaf number. Data are means ±SD (n=5). (C) Dark-induced senescence. DDI, days after dark incubation. Note the more pronounced senescence in the two NOR overexpressors compared with Col-0 at 6 DDI. Leaves 5–7 detached from the various plants (separated by black vertical lines) were used in the experiment. (D) Chlorophyll content of (C), at 6 DDI of Col-0, OX-L6, and OX-L8 genotypes (n=5). (E) Expression of AtSAG12 in detached leaves 5–7 of Col-0, OX-L6, and OX-L8 plants at 6 DDI. The y-axis indicates the expression level (40-dCt). Data are means ±SD of three biological replicates. Asterisks in (B), (D), and (E) indicate a significant difference from the Col-0 wild type (Student’s t-test; *P≤0.05; **P≤0.01).
Fig. 5.
Fig. 5.
Direct regulation of SAGs by NOR. (A) Schematic diagram showing positions of NOR-binding sites in 1 kb promoters of selected genes. Arrows indicates the ATG translational start codon. Gray boxes indicate the NOR-binding sites and black boxes indicate the coding regions of the genes. Sequences of the gene promoters including the NOR-binding sites tested in the ChIP experiments are given in Supplementary Table S3. (B) ChIP-qPCR shows enrichment of SlSAG15, SlSAG113, SISGR1, and SlPPH promoter (1 kb) regions containing the NOR-binding site. Eight-week-old NOR-GFP plants (mature leaves ~3‒5) were harvested for the ChIP experiment. qPCR was performed to quantify the enrichment of the promoter regions. In the case of SlSAG113, which has two potential NOR-binding sites in its promoter (see A), we tested binding of NOR to the sequence proximal to the ATG start codon. Values were normalized to the values for Solyc04g009030 (promoter lacking a NOR-binding site). Data are the means ±SD of two independent biological replicates, each determined in three technical replicates.
Fig. 6.
Fig. 6.
Heat map of differentially expressed genes in NOR-IOE and ami-NOR plants. (A) Gene expression was analyzed by qRT-PCR in NOR-IOE seedlings treated with EST (15 µM) for 6 h and compared with expression in mock-treated [ethanol, 0.15% (v/v)] seedlings (left column), or in ami-NOR seedlings compared with wild-type (WT) seedlings. Seedlings were 3 weeks old. The color code indicates the log2 scale of the fold change; blue, down-regulated; red, up-regulated. Data represent means of three biological replicates. Data are means ±SD of three biological replicates. Asterisks indicate a significant difference from mock-treated samples (for NOR-IOE samples) or from the WT (for ami-NOR samples). Student’s t-test; *P≤0.05; **P≤0.01). The full data are given in Supplementary Table S2. (B) ChIP‒qPCR shows enrichment of SlABCG40, SlERT1B, SlKFB20, and SlYLS4 promoter regions containing the NOR-binding site within the 1 kb upstream promoter regions of the corresponding genes. Experimental conditions were as described in the legend to Fig. 5B. Sequences of the gene promoters including the NOR-binding sites tested in the ChIP experiments are given in Supplementary Table S3. Data are the means ±SD of two independent biological replicates, each determined in three technical replicates.
Fig. 7.
Fig. 7.
SlNAP2 acts as an upstream regulator of NOR. (A) Schematic presentation of SlNAP2-binding site 1 (BS1) within the NOR promoter. The sequence of the binding site, which is located in the forward strand of the promoter, is indicated. (B) Expression of NOR in 3-week-old SlNAP2-IOE seedlings treated with estradiol (EST; 15 μM) for 6 h compared with ethanol [0.15% (v/v)]-treated seedlings (Mock). Gene expression was determined by qRT-PCR. Data represent means of three biological replicates. Asterisks indicate a significant difference from mock-treated plants (Student’s t-test; *P≤0.05). (C) ChIP-qPCR shows enrichment of the NOR promoter region containing the SINAP2-binding site 1 (BS1). Mature leaves (nos 3–5) harvested from 8-week-old SlNAP2-GPF plants were used for the ChIP experiment. Values were normalized to the values for Solyc04g009030 (promoter lacking a SlNAP2-binding site). Data are means ±SD of two independent biological replicates, each performed with three technical replicates.
Fig. 8.
Fig. 8.
Model for the regulation of leaf senescence by NOR. NOR positively controls leaf senescence in tomato by directly regulating various senescence-associated genes including, besides others, SlSAG15, SlYLS4, SlPPH, SlKFB20, SlSAG113, and SlSGR1. It also directly regulates the expression of SlABCG40, an ABA transporter-encoding gene. The NAC transcription factor SlNAP2 enhances NOR expression by directly binding to its promoter and, together with NOR, it jointly regulates SlSAG113, SlSGR1, and SlABCG40. In addition, NOR enhances SlNAP2 expression, suggesting a positively acting feed-forward loop involving the two NAC factors. SlNAP2 has previously been reported to contribute to establishing ABA homeostasis during leaf senescence (Ma et al., 2018), to which the activation of SlABCG40 by NOR may contribute. NOR also directly and positively regulates the expression of the fruit ripening-related gene SlERT1B, consistent with its well-known role in this process. Solid lines indicate direct binding of the transcription factor (SlNAP2 or NOR) to target gene promoters, while dashed lines indicate indirect physiological connections.

Similar articles

Cited by

References

    1. Alseekh S, Tohge T, Wendenberg R, et al. 2015. Identification and mode of inheritance of quantitative trait loci for secondary metabolite abundance in tomato. The Plant Cell 27, 485–512. - PMC - PubMed
    1. Arnon DI. 1949. Copper enzymes in isolated chloroplasts. Polyphenoloxidase in Beta vulgaris. Plant Physiology 24, 1–15. - PMC - PubMed
    1. Arvidsson S, Kwasniewski M, Riaño-Pachón DM, Mueller-Roeber B. 2008. QuantPrime—a flexible tool for reliable high-throughput primer design for quantitative PCR. BMC Bioinformatics 9, 465. - PMC - PubMed
    1. Balazadeh S, Riaño-Pachón DM, Mueller-Roeber B. 2008. Transcription factors regulating leaf senescence in Arabidopsis thaliana. Plant Biology 10(Suppl 1), 63–75. - PubMed
    1. Balazadeh S, Schildhauer J, Araújo WL, Munné-Bosch S, Fernie AR, Proost S, Humbeck K, Mueller-Roeber B. 2014. Reversal of senescence by N resupply to N-starved Arabidopsis thaliana: transcriptomic and metabolomic consequences. Journal of Experimental Botany 65, 3975–3992. - PMC - PubMed

Publication types

MeSH terms