

Association of Peritumoral Radiomics With Tumor Biology and Pathologic Response to Preoperative Targeted Therapy for HER2 (ERBB2)-Positive Breast Cancer
- PMID: 31002322
- PMCID: PMC6481453
- DOI: 10.1001/jamanetworkopen.2019.2561
Association of Peritumoral Radiomics With Tumor Biology and Pathologic Response to Preoperative Targeted Therapy for HER2 (ERBB2)-Positive Breast Cancer
Abstract
Importance: There has been significant recent interest in understanding the utility of quantitative imaging to delineate breast cancer intrinsic biological factors and therapeutic response. No clinically accepted biomarkers are as yet available for estimation of response to human epidermal growth factor receptor 2 (currently known as ERBB2, but referred to as HER2 in this study)-targeted therapy in breast cancer.
Objective: To determine whether imaging signatures on clinical breast magnetic resonance imaging (MRI) could noninvasively characterize HER2-positive tumor biological factors and estimate response to HER2-targeted neoadjuvant therapy.
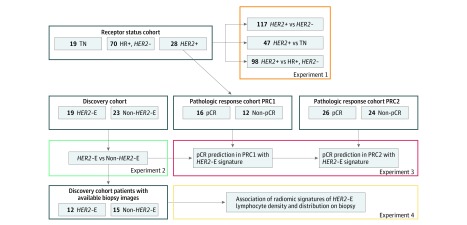
Design, setting, and participants: In a retrospective diagnostic study encompassing 209 patients with breast cancer, textural imaging features extracted within the tumor and annular peritumoral tissue regions on MRI were examined as a means to identify increasingly granular breast cancer subgroups relevant to therapeutic approach and response. First, among a cohort of 117 patients who received an MRI prior to neoadjuvant chemotherapy (NAC) at a single institution from April 27, 2012, through September 4, 2015, imaging features that distinguished HER2+ tumors from other receptor subtypes were identified. Next, among a cohort of 42 patients with HER2+ breast cancers with available MRI and RNaseq data accumulated from a multicenter, preoperative clinical trial (BrUOG 211B), a signature of the response-associated HER2-enriched (HER2-E) molecular subtype within HER2+ tumors (n = 42) was identified. The association of this signature with pathologic complete response was explored in 2 patient cohorts from different institutions, where all patients received HER2-targeted NAC (n = 28, n = 50). Finally, the association between significant peritumoral features and lymphocyte distribution was explored in patients within the BrUOG 211B trial who had corresponding biopsy hematoxylin-eosin-stained slide images. Data analysis was conducted from January 15, 2017, to February 14, 2019.
Main outcomes and measures: Evaluation of imaging signatures by the area under the receiver operating characteristic curve (AUC) in identifying HER2+ molecular subtypes and distinguishing pathologic complete response (ypT0/is) to NAC with HER2-targeting.
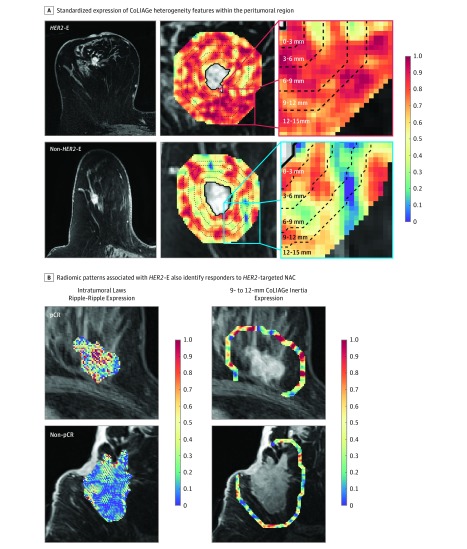
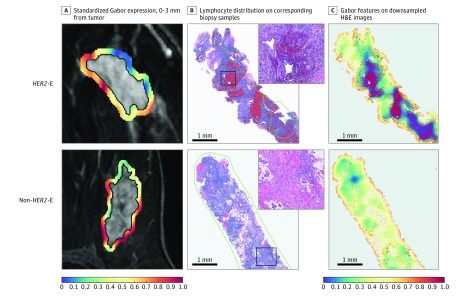
Results: In the 209 patients included (mean [SD] age, 51.1 [11.7] years), features from the peritumoral regions better discriminated HER2-E tumors (maximum AUC, 0.85; 95% CI, 0.79-0.90; 9-12 mm from the tumor) compared with intratumoral features (AUC, 0.76; 95% CI, 0.69-0.84). A classifier combining peritumoral and intratumoral features identified the HER2-E subtype (AUC, 0.89; 95% CI, 0.84-0.93) and was significantly associated with response to HER2-targeted therapy in both validation cohorts (AUC, 0.80; 95% CI, 0.61-0.98 and AUC, 0.69; 95% CI, 0.53-0.84). Features from the 0- to 3-mm peritumoral region were significantly associated with the density of tumor-infiltrating lymphocytes (R2 = 0.57; 95% CI, 0.39-0.75; P = .002).
Conclusions and relevance: A combination of peritumoral and intratumoral characteristics appears to identify intrinsic molecular subtypes of HER2+ breast cancers from imaging, offering insights into immune response within the peritumoral environment and suggesting potential benefit for treatment guidance.
Conflict of interest statement
Figures
Similar articles
-
Intratumoral and peritumoral radiomics for the pretreatment prediction of pathological complete response to neoadjuvant chemotherapy based on breast DCE-MRI.Breast Cancer Res. 2017 May 18;19(1):57. doi: 10.1186/s13058-017-0846-1. Breast Cancer Res. 2017. PMID: 28521821 Free PMC article.
-
Distinguishing Low Expression Levels of Human Epidermal Growth Factor Receptor 2 in Breast Cancer: Insights from Qualitative and Quantitative Magnetic Resonance Imaging Analysis.Tomography. 2025 Mar 10;11(3):31. doi: 10.3390/tomography11030031. Tomography. 2025. PMID: 40137571 Free PMC article.
-
Imaging and Clinicopathologic Features Associated With Pathologic Complete Response in HER2-positive Breast Cancer Receiving Neoadjuvant Chemotherapy With Dual HER2 Blockade.Clin Breast Cancer. 2020 Feb;20(1):25-32. doi: 10.1016/j.clbc.2019.06.015. Epub 2019 Aug 21. Clin Breast Cancer. 2020. PMID: 31519449
-
A nomogram to predict pathologic complete response (pCR) and the value of tumor-infiltrating lymphocytes (TILs) for prediction of response to neoadjuvant chemotherapy (NAC) in breast cancer patients.Breast Cancer Res Treat. 2019 Jan;173(2):255-266. doi: 10.1007/s10549-018-4981-x. Epub 2018 Oct 15. Breast Cancer Res Treat. 2019. PMID: 30324273 Review.
-
Tumor-infiltrating lymphocytes in patients with HER2-positive breast cancer treated with neoadjuvant chemotherapy plus trastuzumab, lapatinib or their combination: A meta-analysis of randomized controlled trials.Cancer Treat Rev. 2017 Jun;57:8-15. doi: 10.1016/j.ctrv.2017.04.005. Epub 2017 May 2. Cancer Treat Rev. 2017. PMID: 28525810 Review.
Cited by
-
Intratumoral and peritumoral radiomics predict pathological response after neoadjuvant chemotherapy against advanced gastric cancer.Insights Imaging. 2024 Jan 25;15(1):23. doi: 10.1186/s13244-023-01584-6. Insights Imaging. 2024. PMID: 38270724 Free PMC article.
-
Radiomics in Oncology, Part 2: Thoracic, Genito-Urinary, Breast, Neurological, Hematologic and Musculoskeletal Applications.Cancers (Basel). 2021 May 29;13(11):2681. doi: 10.3390/cancers13112681. Cancers (Basel). 2021. PMID: 34072366 Free PMC article. Review.
-
Preoperative CT-based intra- and peri-tumoral radiomic models for differentiating benign and malignant tumors of the parotid gland: a two-center study.Am J Cancer Res. 2024 Sep 15;14(9):4445-4458. doi: 10.62347/AXQW1100. eCollection 2024. Am J Cancer Res. 2024. PMID: 39417193 Free PMC article.
-
Artificial Intellgence in the Era of Precision Oncological Imaging.Technol Cancer Res Treat. 2022 Jan-Dec;21:15330338221141793. doi: 10.1177/15330338221141793. Technol Cancer Res Treat. 2022. PMID: 36426565 Free PMC article. Review.
-
Intra- and peritumoral radiomics features based on multicenter automatic breast volume scanner for noninvasive and preoperative prediction of HER2 status in breast cancer: a model ensemble research.Sci Rep. 2024 Feb 29;14(1):5020. doi: 10.1038/s41598-024-55838-4. Sci Rep. 2024. PMID: 38424285 Free PMC article. Clinical Trial.
References
-
- Varadan V, Gilmore H, Miskimen KLS, et al. . Immune signatures following single dose trastuzumab predict pathologic response to preoperative trastuzumab and chemotherapy in HER2-positive early breast cancer. Clin Cancer Res. 2016;22(13):3249-3259. doi:10.1158/1078-0432.CCR-15-2021 - DOI - PMC - PubMed
Publication types
MeSH terms
Substances
Grants and funding
LinkOut - more resources
Full Text Sources
Other Literature Sources
Medical
Research Materials
Miscellaneous
