

Lithium ameliorates tubule-interstitial injury through activation of the mTORC2/protein kinase B pathway
- PMID: 31002704
- PMCID: PMC6474631
- DOI: 10.1371/journal.pone.0215871
Lithium ameliorates tubule-interstitial injury through activation of the mTORC2/protein kinase B pathway
Abstract
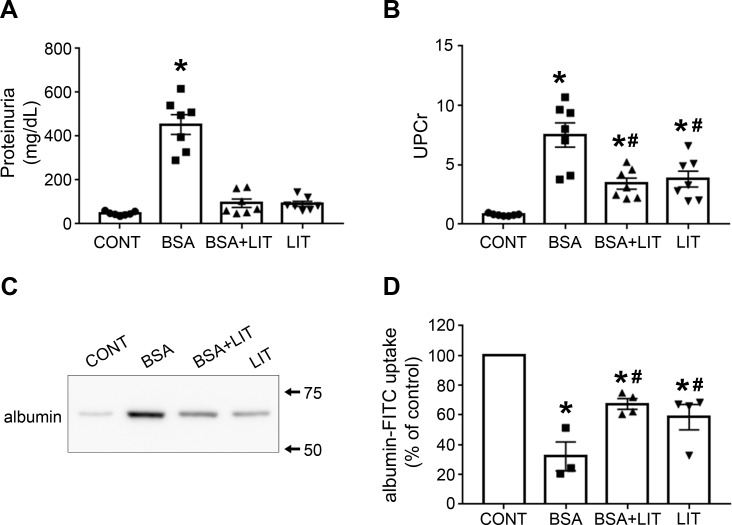
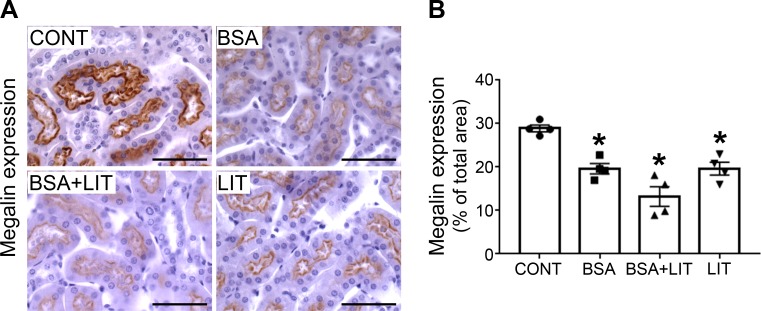
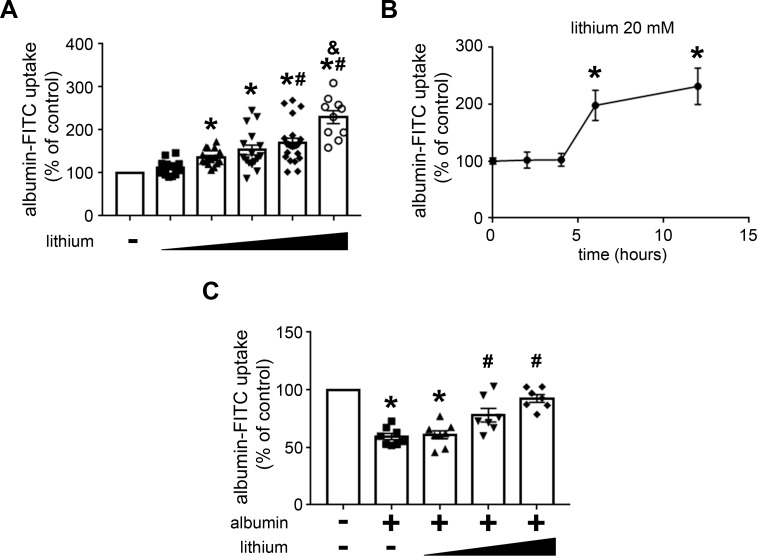
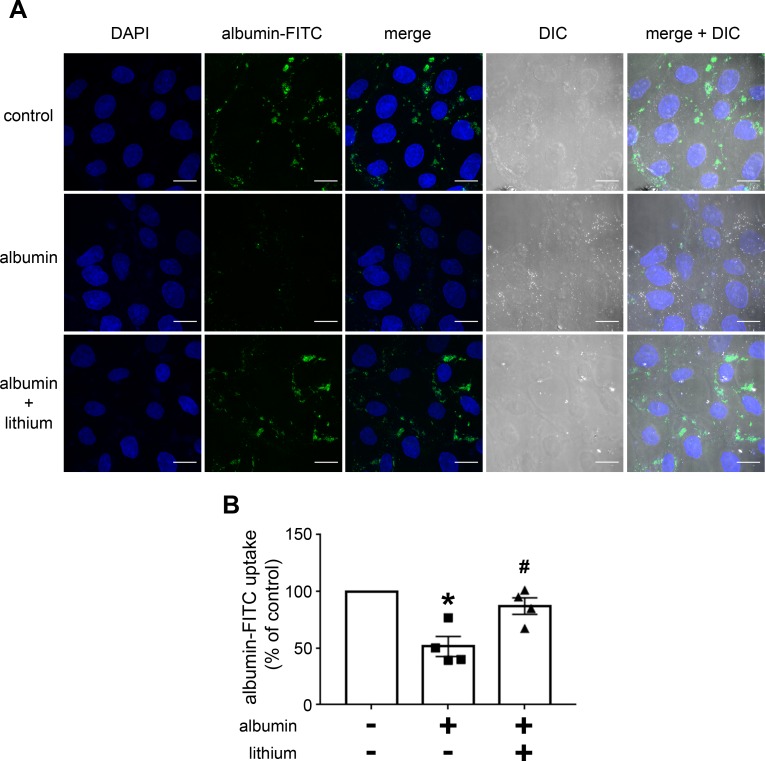
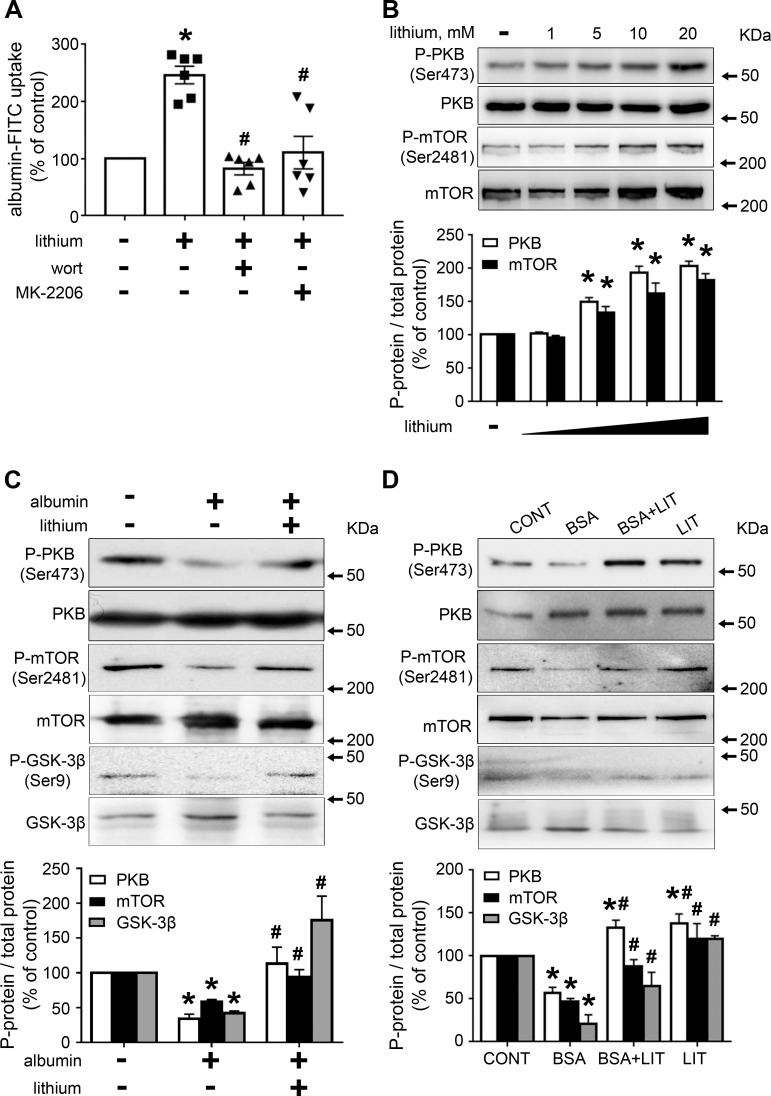
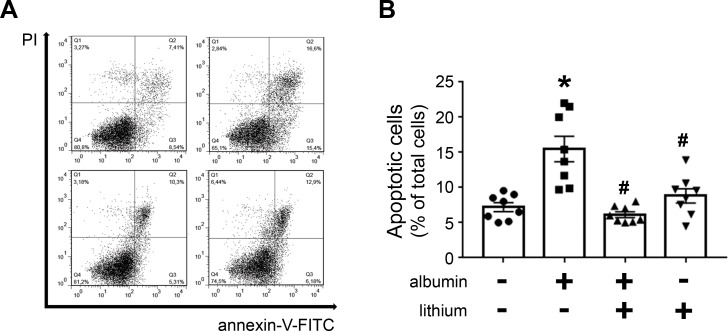
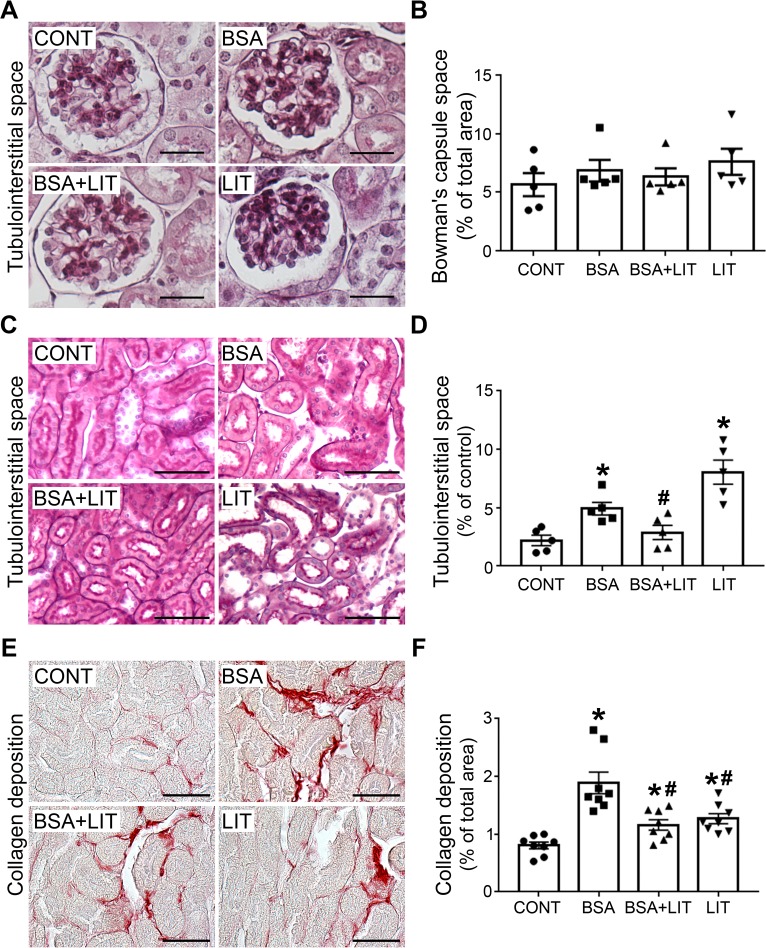
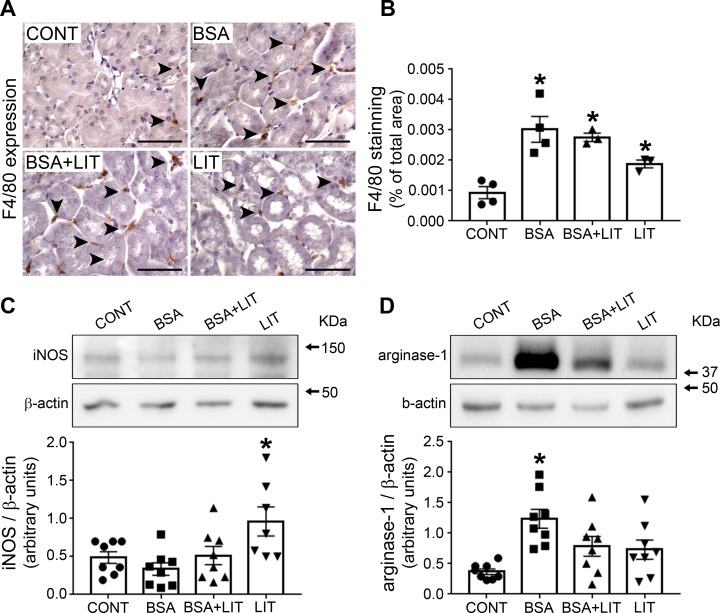
Tubule-interstitial injury (TII) is a critical step in the progression of renal disease. It has been proposed that changes in proximal tubule (PT) albumin endocytosis plays an important role in the development of TII. Some reports have shown protective effects of lithium on kidney injury animal models that was correlated to proteinuria. We tested the hypothesis that lithium treatment ameliorates the development of TII due to changes in albumin endocytosis. Two experimental models were used: (1) TII induced by albumin overload in an animal model; (2) LLC-PK1 cells, a PT cell line. Lithium treatment ameliorates TII induced by albumin overload measured by (1) proteinuria; (2) collagen deposition; (3) area of tubule-interstitial space, and (4) macrophage infiltration. Lithium treatment increased mTORC2 activity leading to the phosphorylation of protein kinase B (PKB) at Ser473 and its activation. This mechanism enhanced albumin endocytosis in PT cells, which decreased the proteinuria observed in TII induced by albumin overload. This effect did not involve changes in the expression of megalin, a PT albumin receptor. In addition, activation of this pathway decreased apoptosis in LLC-PK1 cells, a PT cell line, induced by higher albumin concentration, similar to that found in pathophysiologic conditions. Our results indicate that the protective role of lithium treatment on TII induced by albumin overload involves an increase in PT albumin endocytosis due to activation of the mTORC2/PKB pathway. These results open new possibilities in understanding the effects of lithium on the progression of renal disease.
Conflict of interest statement
The authors have declared that no competing interests exist.
Figures
Similar articles
-
Albumin Expands Albumin Reabsorption Capacity in Proximal Tubule Epithelial Cells through a Positive Feedback Loop between AKT and Megalin.Int J Mol Sci. 2022 Jan 13;23(2):848. doi: 10.3390/ijms23020848. Int J Mol Sci. 2022. PMID: 35055044 Free PMC article.
-
Megalin-mediated albumin endocytosis in renal proximal tubules is involved in the antiproteinuric effect of angiotensin II type 1 receptor blocker in a subclinical acute kidney injury animal model.Biochim Biophys Acta Gen Subj. 2021 Sep;1865(9):129950. doi: 10.1016/j.bbagen.2021.129950. Epub 2021 Jun 16. Biochim Biophys Acta Gen Subj. 2021. PMID: 34144121
-
PKB is a central molecule in the modulation of Na+-ATPase activity by albumin in renal proximal tubule cells.Arch Biochem Biophys. 2019 Oct 15;674:108115. doi: 10.1016/j.abb.2019.108115. Epub 2019 Sep 24. Arch Biochem Biophys. 2019. PMID: 31560867
-
Chloride channels and endocytosis: new insights from Dent's disease and ClC-5 knockout mice.Nephron Physiol. 2005;99(3):p69-73. doi: 10.1159/000083210. Nephron Physiol. 2005. PMID: 15637424 Review.
-
Molecular mechanisms of receptor-mediated endocytosis in the renal proximal tubular epithelium.J Biomed Biotechnol. 2010;2010:403272. doi: 10.1155/2010/403272. J Biomed Biotechnol. 2010. PMID: 20011067 Free PMC article. Review.
Cited by
-
IL-4 Receptor α Chain Protects the Kidney Against Tubule-Interstitial Injury Induced by Albumin Overload.Front Physiol. 2020 Feb 27;11:172. doi: 10.3389/fphys.2020.00172. eCollection 2020. Front Physiol. 2020. PMID: 32174845 Free PMC article.
-
Albumin Expands Albumin Reabsorption Capacity in Proximal Tubule Epithelial Cells through a Positive Feedback Loop between AKT and Megalin.Int J Mol Sci. 2022 Jan 13;23(2):848. doi: 10.3390/ijms23020848. Int J Mol Sci. 2022. PMID: 35055044 Free PMC article.
-
Downregulation of Akt induces proximal tubule epithelial cell apoptosis via Foxo-1-BIM pathway in proteinuric states.Res Sq [Preprint]. 2025 Apr 25:rs.3.rs-6234375. doi: 10.21203/rs.3.rs-6234375/v1. Res Sq. 2025. PMID: 40313745 Free PMC article. Preprint.
-
High Doses of Essential Oil of Croton Zehntneri Induces Renal Tubular Damage.Plants (Basel). 2021 Jul 9;10(7):1400. doi: 10.3390/plants10071400. Plants (Basel). 2021. PMID: 34371603 Free PMC article.
-
Oxidized Albumin as a Mediator of Kidney Disease.Antioxidants (Basel). 2021 Mar 8;10(3):404. doi: 10.3390/antiox10030404. Antioxidants (Basel). 2021. PMID: 33800425 Free PMC article. Review.
References
-
- Bielecka AM, Obuchowicz E. Antiapoptotic action of lithium and valproate. Pharmacol Rep. 2018; 60:771–782. - PubMed
Publication types
MeSH terms
Substances
LinkOut - more resources
Full Text Sources
Miscellaneous
