

Evaluating DNA methylation age on the Illumina MethylationEPIC Bead Chip
- PMID: 31002714
- PMCID: PMC6474589
- DOI: 10.1371/journal.pone.0207834
Evaluating DNA methylation age on the Illumina MethylationEPIC Bead Chip
Abstract
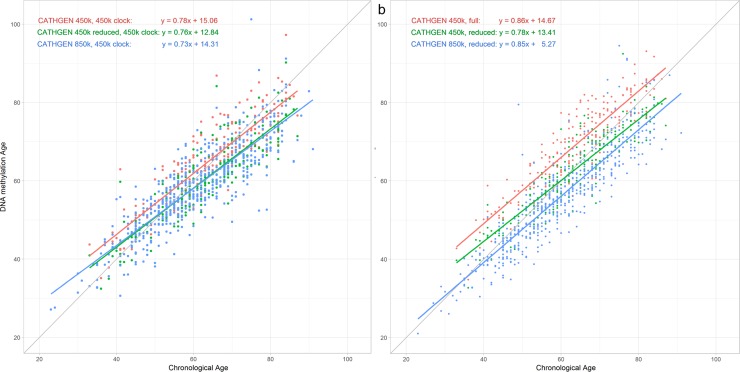
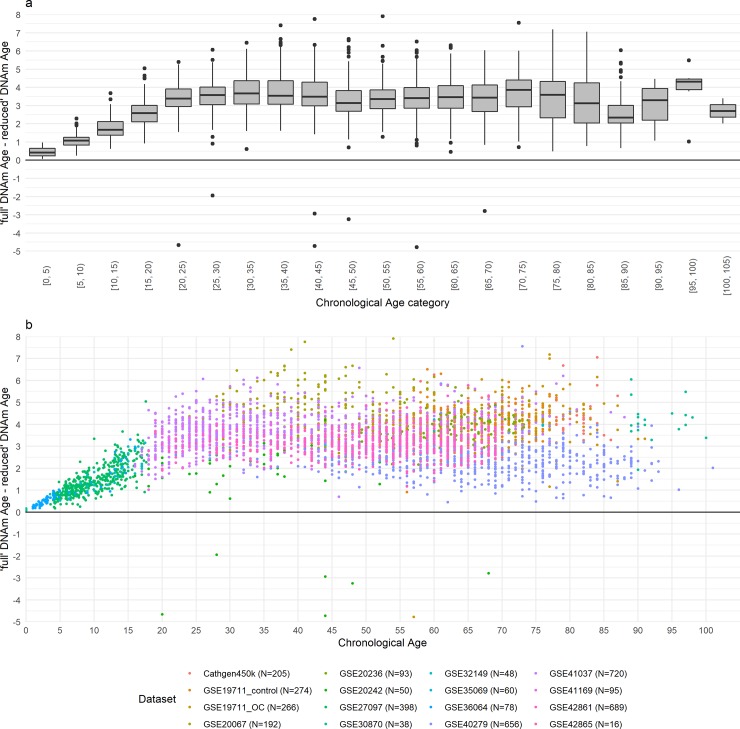
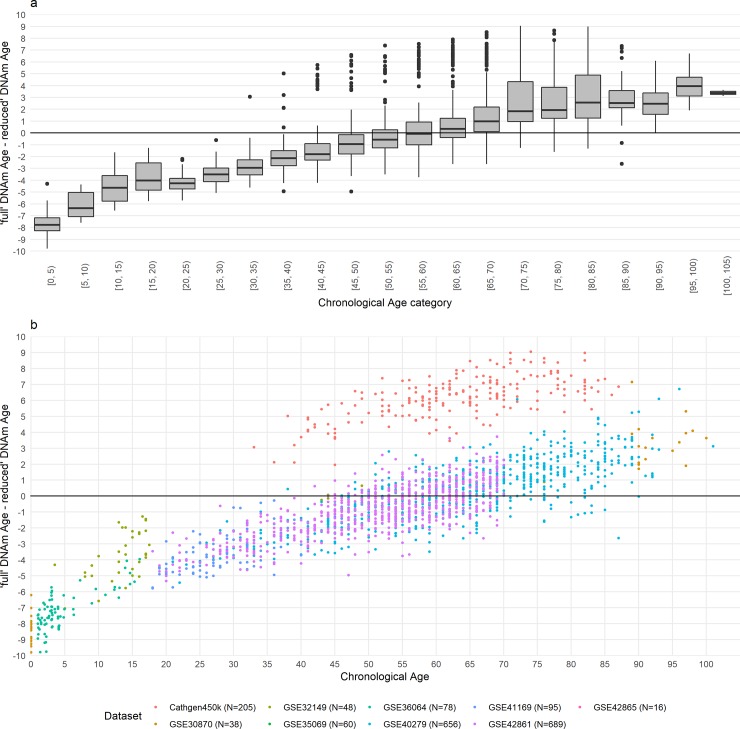
DNA methylation age (DNAm age) has become a widely utilized epigenetic biomarker for the aging process. The Horvath method for determining DNAm age is perhaps the most widely utilized and validated DNA methylation age assessment measure. Horvath DNAm age is calculated based on methylation measurements at 353 loci, present on Illumina's 450k and 27k DNA methylation microarrays. With increasing use of the more recently developed Illumina MethylationEPIC (850k) microarray, it is worth revisiting this aging measure to evaluate estimation differences due to array design. Of the requisite 353 loci, 17 are missing from the 850k microarray. Similarly, an alternate, 71 loci DNA methylation age assessment measure created by Hannum et al. is missing 6 requisite loci. Using 17 datasets with 27k, 450k, and/or 850k methylation data, we compared each sample's epigenetic age estimated from all 353 loci required by the Horvath DNAm age calculator, and using only the 336 loci available on the 850k array. In 450k/27k data, removing loci not on the 850k array resulted in underestimation of Horvath's DNAm age. Underestimation of Horvath DNAm age increased from ages 0 to ~20, remaining stable thereafter (mean deviation = -3.46 y, SD = 1.13 for individuals ≥20 years). Underestimation of Horvath's DNAm age by the reduced 450k/27k data was similar to the underestimation observed in the 850k data indicating it is driven by missing probes. In analogous examination of Hannum's DNAm age, the magnitude and direction of epigenetic age misestimation varied with chronological age. In conclusion, inter-array deviations in DNAm age estimations may be largely driven by missing probes between arrays, despite default probe imputation procedures. Though correlations and associations based on Horvath's DNAm age may be unaffected, researchers should exercise caution when interpreting results based on absolute differences in DNAm age or when mixing samples assayed on different arrays.
Conflict of interest statement
The authors have declared that no competing interests exist.
Figures
Similar articles
-
Systematic evaluation of DNA methylation age estimation with common preprocessing methods and the Infinium MethylationEPIC BeadChip array.Clin Epigenetics. 2018 Oct 16;10(1):123. doi: 10.1186/s13148-018-0556-2. Clin Epigenetics. 2018. PMID: 30326963 Free PMC article.
-
Identifying blood-specific age-related DNA methylation markers on the Illumina MethylationEPIC® BeadChip.Forensic Sci Int. 2019 Oct;303:109944. doi: 10.1016/j.forsciint.2019.109944. Epub 2019 Sep 12. Forensic Sci Int. 2019. PMID: 31546163
-
Childhood trauma is linked to epigenetic age deceleration in young adults with previous youth residential care placements.Eur J Psychotraumatol. 2024;15(1):2379144. doi: 10.1080/20008066.2024.2379144. Epub 2024 Jul 25. Eur J Psychotraumatol. 2024. PMID: 39051592 Free PMC article.
-
Establishing an analytic pipeline for genome-wide DNA methylation.Clin Epigenetics. 2016 Apr 27;8:45. doi: 10.1186/s13148-016-0212-7. eCollection 2016. Clin Epigenetics. 2016. PMID: 27127542 Free PMC article. Review.
-
Analysis of epigenetic aging in vivo and in vitro: Factors controlling the speed and direction.Exp Biol Med (Maywood). 2020 Nov;245(17):1543-1551. doi: 10.1177/1535370220947015. Epub 2020 Aug 6. Exp Biol Med (Maywood). 2020. PMID: 32762265 Free PMC article. Review.
Cited by
-
Is virtue its own reward? Moral identity, empathy, and volunteering during adolescence as predictors of subsequent epigenetic aging.Appl Psychol Health Well Being. 2025 May;17(2):e70026. doi: 10.1111/aphw.70026. Appl Psychol Health Well Being. 2025. PMID: 40186460 Free PMC article.
-
Accuracy and challenges in age estimation in adults: a scoping review of anthropological, dental, biochemical, and molecular methods.Forensic Sci Med Pathol. 2025 Jul 18. doi: 10.1007/s12024-025-01041-4. Online ahead of print. Forensic Sci Med Pathol. 2025. PMID: 40679711 Review.
-
Associations between alcohol use and accelerated biological ageing.Addict Biol. 2022 Jan;27(1):e13100. doi: 10.1111/adb.13100. Epub 2021 Oct 12. Addict Biol. 2022. PMID: 34636470 Free PMC article.
-
Chemical and climatic environmental exposures and epigenetic aging: A systematic review.Environ Res. 2025 Jun 1;274:121347. doi: 10.1016/j.envres.2025.121347. Epub 2025 Mar 7. Environ Res. 2025. PMID: 40058550
-
Genomic, Proteomic, and Phenotypic Biomarkers of COVID-19 Severity: Protocol for a Retrospective Observational Study.JMIR Res Protoc. 2024 Feb 14;13:e50733. doi: 10.2196/50733. JMIR Res Protoc. 2024. PMID: 38354037 Free PMC article.
References
-
- Horvath S. DNA Methylation Age Calculator [Internet]. [cited 1 Jan 2017]. Available: dnamage.genetics.ucla.edu
Publication types
MeSH terms
Grants and funding
LinkOut - more resources
Full Text Sources
Medical
