. 2019 Apr 18;177(3):597-607.e9.
doi: 10.1016/j.cell.2019.03.044.

Human Gain-of-Function MC4R Variants Show Signaling Bias and Protect against Obesity

Affiliations

Human Gain-of-Function MC4R Variants Show Signaling Bias and Protect against Obesity

Luca A Lotta et al. Cell. .

Abstract

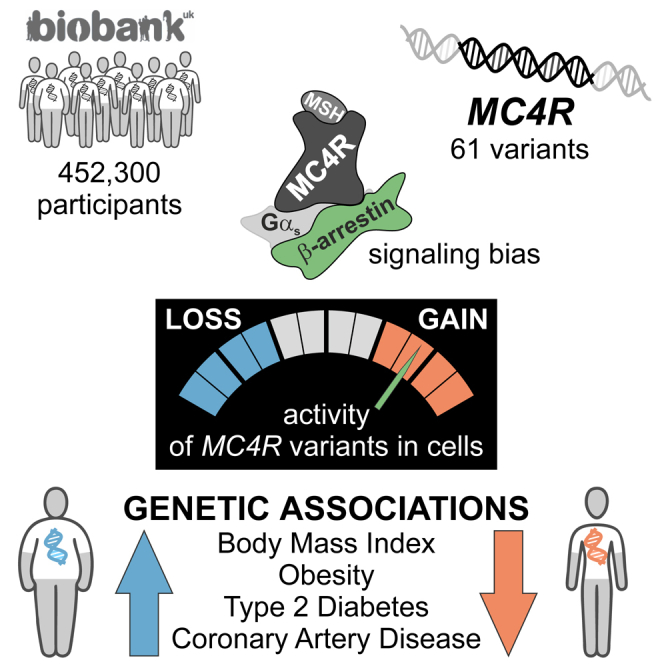
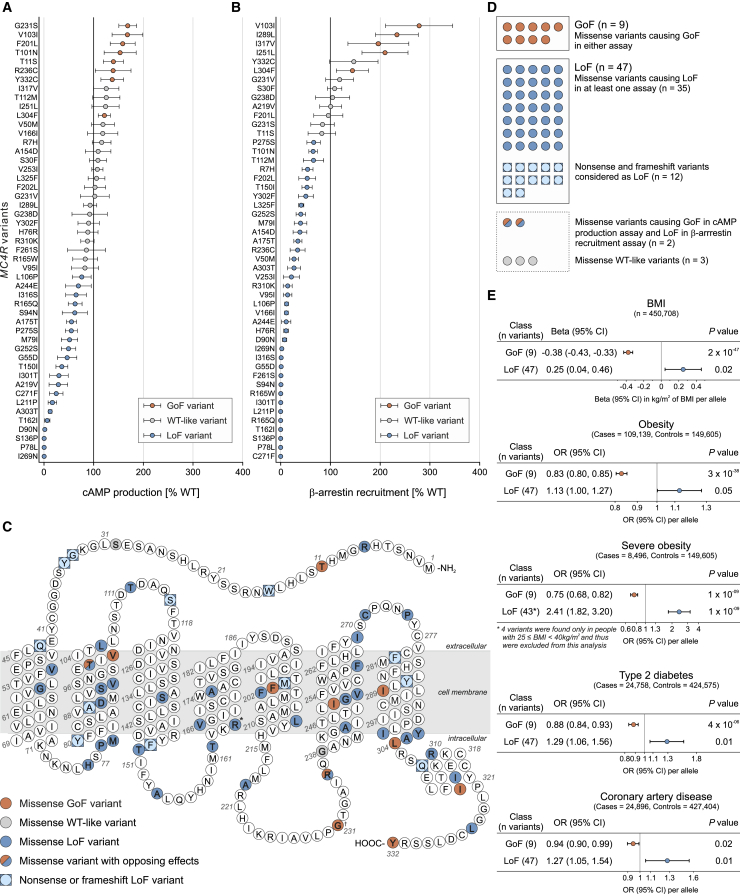
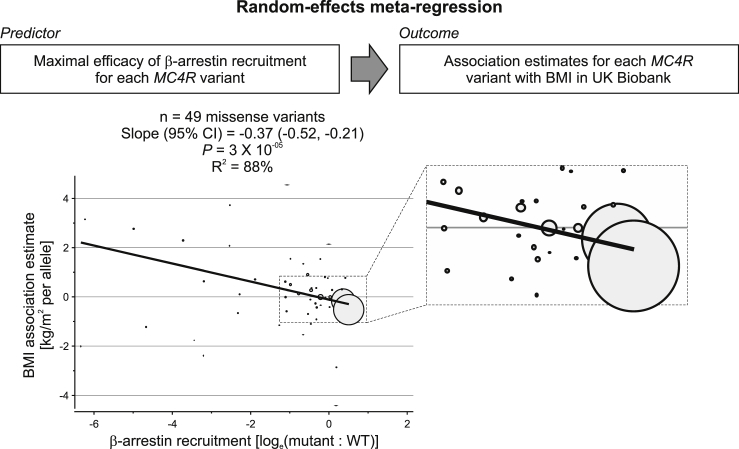
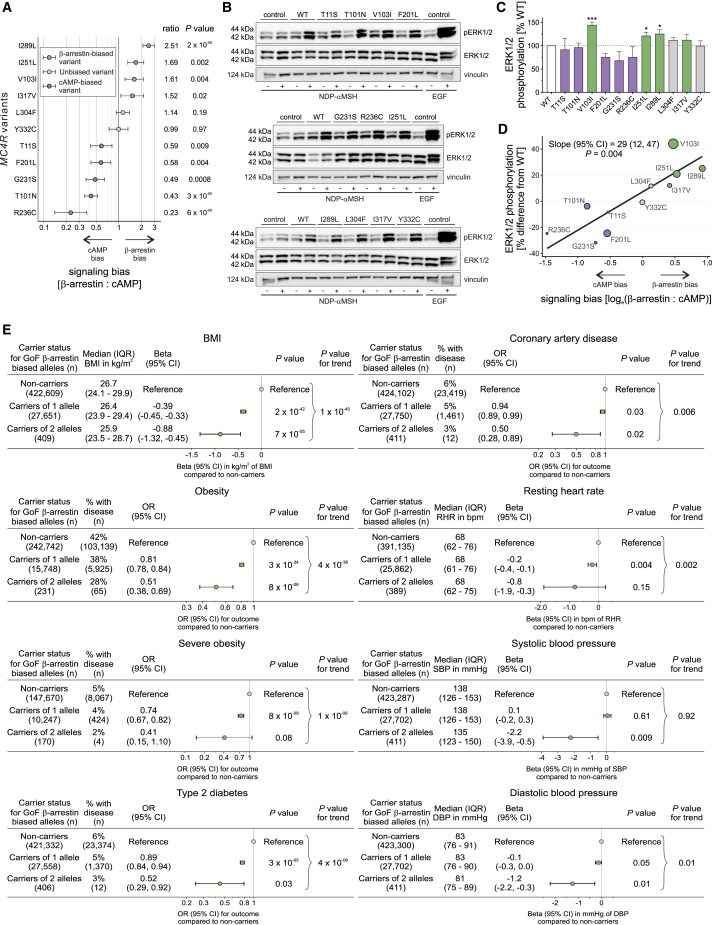
The melanocortin 4 receptor (MC4R) is a G protein-coupled receptor whose disruption causes obesity. We functionally characterized 61 MC4R variants identified in 0.5 million people from UK Biobank and examined their associations with body mass index (BMI) and obesity-related cardiometabolic diseases. We found that the maximal efficacy of β-arrestin recruitment to MC4R, rather than canonical Gαs-mediated cyclic adenosine-monophosphate production, explained 88% of the variance in the association of MC4R variants with BMI. While most MC4R variants caused loss of function, a subset caused gain of function; these variants were associated with significantly lower BMI and lower odds of obesity, type 2 diabetes, and coronary artery disease. Protective associations were driven by MC4R variants exhibiting signaling bias toward β-arrestin recruitment and increased mitogen-activated protein kinase pathway activation. Harnessing β-arrestin-biased MC4R signaling may represent an effective strategy for weight loss and the treatment of obesity-related cardiometabolic diseases.

Keywords: GPCRs; MC4R; UK Biobank; biased signaling; genetics; melanocortin; obesity; β-arrestin.


Figures

None
Graphical abstract
Figure 1
Figure 1
Gain-of-Function MC4R Variants Are Associated with Protection from Obesity and Its Complications (A and B) Maximal efficacy of (A) NDP-αMSH-induced cAMP production and (B) β-arrestin recruitment for mutant MC4Rs. Data represented as mean (95% CI) of 4–12 independent experiments; each mutant expressed as % WT. Variants classified as GoF (orange), LoF (blue), or WT-like (gray) based on statistically significant differences between WT and mutant (unpaired single-sample t test). (C) MC4R protein highlighting amino acids affected by variants. †Residues affected by >1 variant; R165W (LoF) and R165Q (LoF); †G231S (GoF) and G231V (WT-like). (D) Counts for GoF (n = 9) and LoF (n = 47) variants included in genetic association analyses. Five variants with opposite effects in the two assays or WT-like results were excluded. (E) Genetic associations of GoF and LoF MC4R variants with BMI and obesity and its complications. OR, odds ratio; CI, confidence interval; BMI, body mass index, n, number of participants. See also Tables S1, S2, S3, and S4.
Figure 2
Figure 2
β-Arrestin Recruitment by Different MC4R Variants Explains a Significant Proportion of the Variance in Their Association with BMI Model (top) and results (bottom) from a meta-regression analysis in which β-arrestin recruitment for each MC4R mutant was the predictor and association estimates for BMI were the outcome. Circles represent each variant, with circle size proportional to the weight of each variant in the model. The enlarged box shows the area where variants with the largest weight clustered. CI, confidence interval; BMI, body mass index. Sensitivity analyses excluding the two variants with the largest weight and leave-one-out analyses are in Table S5.
Figure 3
Figure 3
Gain-of-Function MC4R Variants that Exhibit Bias toward β-Arrestin-Mediated Signaling Protect against Obesity and Its Complications (A) Signaling bias for 11 GoF MC4R mutants calculated as ratio (95% CI) of geometric means for maximal activity of β-arrestin to cAMP; data from 4–12 experiments. The null hypothesis of no bias (ratio = 1) was tested using unpaired two-sample t test. Variants were classified as biased toward β-arrestin (green), biased toward cAMP (purple), or unbiased (gray). (B and C) (B) Representative western blots and (C) quantification of ERK1/2 phosphorylation (expressed as % WT) before (−) and after (+) NDP-αMSH stimulation of GoF MC4R mutants; epidermal growth factor (EGF) used as a positive control; vinculin used as a loading control. Data represented as mean ±SEM from 3–8 independent experiments; statistical significance of differences between WT and mutant (unpaired single-sample t test). (D) Meta-regression analysis showing that greater bias for β-arrestin recruitment predicts greater ERK1/2 phosphorylation for GoF variants (depicted as circles with size proportional to precision in ERK1/2 phosphorylation estimates). (E) Associations with BMI, obesity, severe obesity, type 2 diabetes, coronary artery disease, resting heart rate (RHR) in beats/min (bpm), and systolic and diastolic blood pressure (SBP and DBP, respectively) in millimeters of mercury (mmHg) by carrier status for β-arrestin-biased GoF MC4R alleles. OR, odds ratio; CI, confidence interval; IQR, interquartile range; n, number of participants. See also Tables S6 and S7.
Figure S1
Figure S1
Phenome-wide Scan of the Associations of V103I MC4R with 353 Common Diagnoses Analyses were performed in European ancestry participants of UK Biobank. Only diagnosis codes with > 500 cases were included. Diagnosis codes were grouped in 19 broad categories. Each triangle represents the association for a given diagnosis code. Full triangles that are upward-pointing represent associations in a risk increasing direction, while open triangles that are downward-pointing represent associations in a protective direction. The horizontal broken line represents the statistical significance threshold of p < 0.00014, corresponding to a Bonferroni correction for 353 diagnoses. Related to Figure 4.
Figure 4
Figure 4
Effects of V103I MC4R on Signaling and Receptor Internalization (A and B) Dose-response curves for αMSH-, βMSH-, and NDP-αMSH-induced (A) cAMP production and (B) β-arrestin recruitment for V103I compared to WT MC4R and mock transfected cells expressed as % WT. Data represented as mean ± SEM from 4 independent experiments. (C and D) Representative western blots and quantification of ERK1/2 phosphorylation by WT and V103I MC4R before (−) and after (+) stimulation by (C) αMSH and βMSH and (D) NDP-αMSH in a time-course experiment; EGF used as a positive control; vinculin used as a loading control. (E and F) (E) Confocal microscopy and (F) receptor cell surface expression quantified by FACS for cells expressing WT and V103I MC4R before (−) and after (+) stimulation by NDP-αMSH. Scale bars, 50 μm; 10 μm (inset). Data represented as mean ± SEM from 3–8 independent experiments; statistical significance of differences between WT and mutant analyzed with unpaired single-sample t test (A, B, C, D, F). p < 0.05; ∗∗p < 0.01. AUC; area under the curve. See also Figures S1 and S2 and Table S7 and S8.
Figure S2
Figure S2
Effects of V103I MC4R on cAMP Production, β-arrestin Recruitment, MAPK Pathway Activation, and Cell Surface Expression Representative real-time measurement of (A) cAMP (B) β-arrestin recruitment upon NDP-αMSH stimulation. (C) Time-course quantification and (D) respective area under the curve (AUC) of ERK1/2 phosphorylation assessed by Homogeneous Time-Resolved Resonance Energy Transfer (HTRF)-based sandwich immunoassay (Cisbio, 64AERPET); data expressed as % WT. WT (open squares), V103I (solid squares) MC4R; mean ± standard error; (n = 4); statistical significance of differences between WT and mutant analyzed in an unpaired single-sample t test; ∗∗p < 0.01. (E) Confocal microscopy on COS-7 cells expressing WT and V103I MC4R unstimulated and upon NDP-αMSH stimulation. MC4R in red (Anti-FLAG (M2) antibody), plasma membrane in green (wheat germ agglutinin) and nuclei in blue (DAPI). Scale bars, 50 μm. (F) Effects of V103I MC4R on receptor internalization quantified by FACS. Representative data on receptor internalization using HeLa cells transiently transfected with FLAG-MC4R WT or V103I. Mock-transfected cells were used as controls for non-specific binding of the antibody (FLAG-PE; negative control). Mean fluorescence intensity (MFI) represents the amount of MC4R present at the cell surface; receptor internalization was quantified using the mean fluorescence intensity (MFI) values of FLAG-PE+ cells from unstimulated (-) and NDP-αMSH stimulated WT and V103I MC4R. Related to Figure 4.
Figure 5
Figure 5
Mechanisms by Which V103I MC4R Causes a Gain-of-Function (A and B) Schematic of mechanisms by which V103I MC4R (pink dot) results in GoF. G proteins (α,β,γ); MSH, melanocyte stimulating hormone; AC, adenylate cyclase; CRE, cyclic AMP response element; TF, transcription factor.

Comment in

Similar articles

Cited by

References

    1. Bray G.A., Frühbeck G., Ryan D.H., Wilding J.P. Management of obesity. Lancet. 2016;387:1947–1956. - PubMed
    1. Burgess S., Butterworth A., Thompson S.G. Mendelian randomization analysis with multiple genetic variants using summarized data. Genet. Epidemiol. 2013;37:658–665. - PMC - PubMed
    1. Bycroft C., Freeman C., Petkova D., Band G., Elliott L.T., Sharp K., Motyer A., Vukcevic D., Delaneau O., O’Connell J. The UK Biobank resource with deep phenotyping and genomic data. Nature. 2018;562:203–209. - PMC - PubMed
    1. Chen K.Y., Muniyappa R., Abel B.S., Mullins K.P., Staker P., Brychta R.J., Zhao X., Ring M., Psota T.L., Cone R.D. RM-493, a melanocortin-4 receptor (MC4R) agonist, increases resting energy expenditure in obese individuals. J. Clin. Endocrinol. Metab. 2015;100:1639–1645. - PMC - PubMed
    1. Clarke R., Peden J.F., Hopewell J.C., Kyriakou T., Goel A., Heath S.C., Parish S., Barlera S., Franzosi M.G., Rust S., PROCARDIS Consortium Genetic variants associated with Lp(a) lipoprotein level and coronary disease. N. Engl. J. Med. 2009;361:2518–2528. - PubMed

Publication types

MeSH terms