

Population Pharmacokinetics of Clofarabine as Part of Pretransplantation Conditioning in Pediatric Subjects before Hematopoietic Cell Transplantation
- PMID: 31002993
- PMCID: PMC10291704
- DOI: 10.1016/j.bbmt.2019.04.017
Population Pharmacokinetics of Clofarabine as Part of Pretransplantation Conditioning in Pediatric Subjects before Hematopoietic Cell Transplantation
Abstract
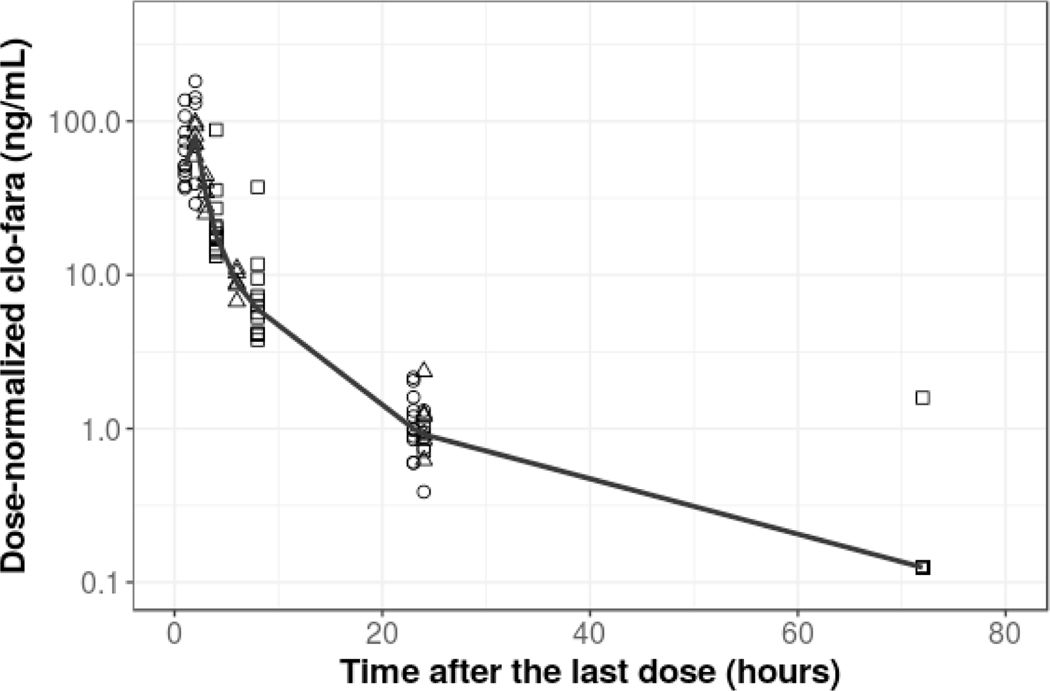
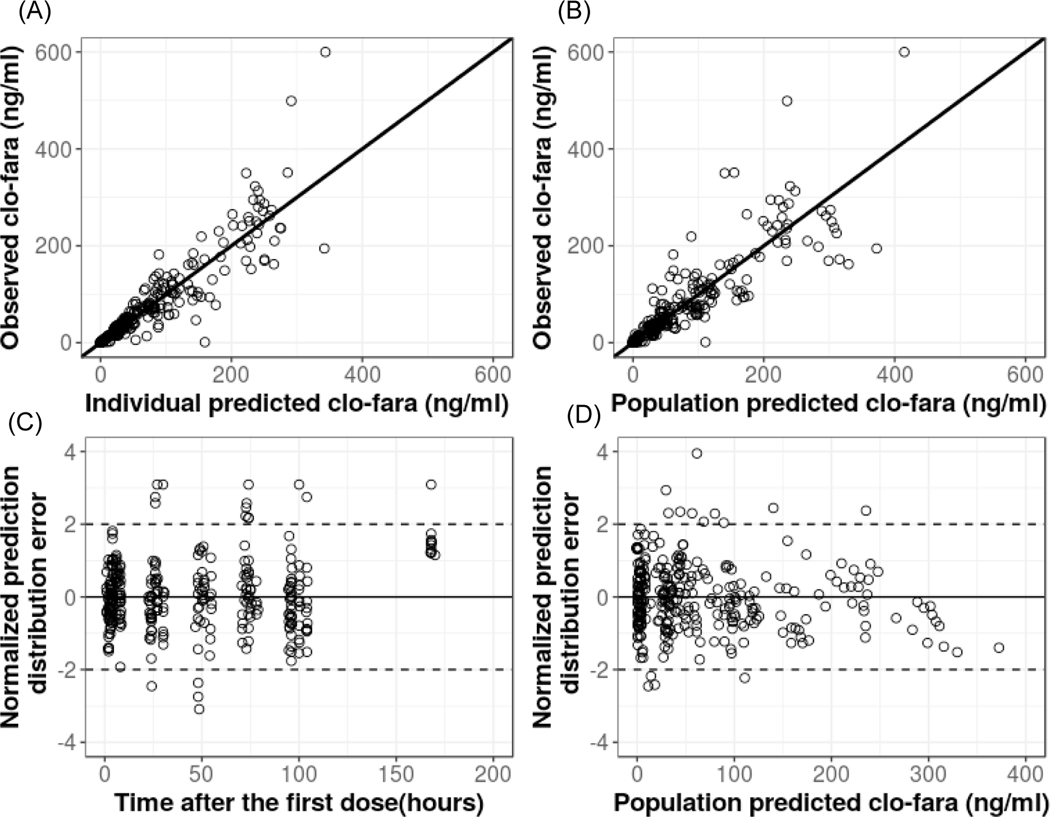
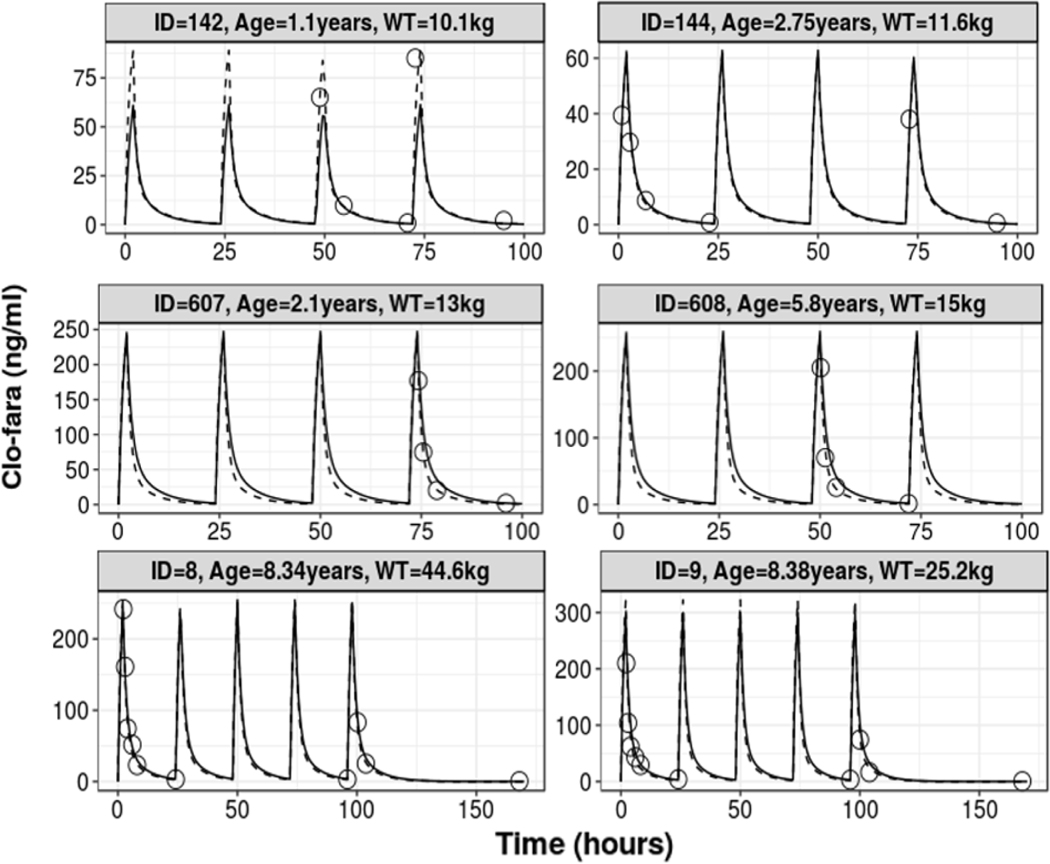
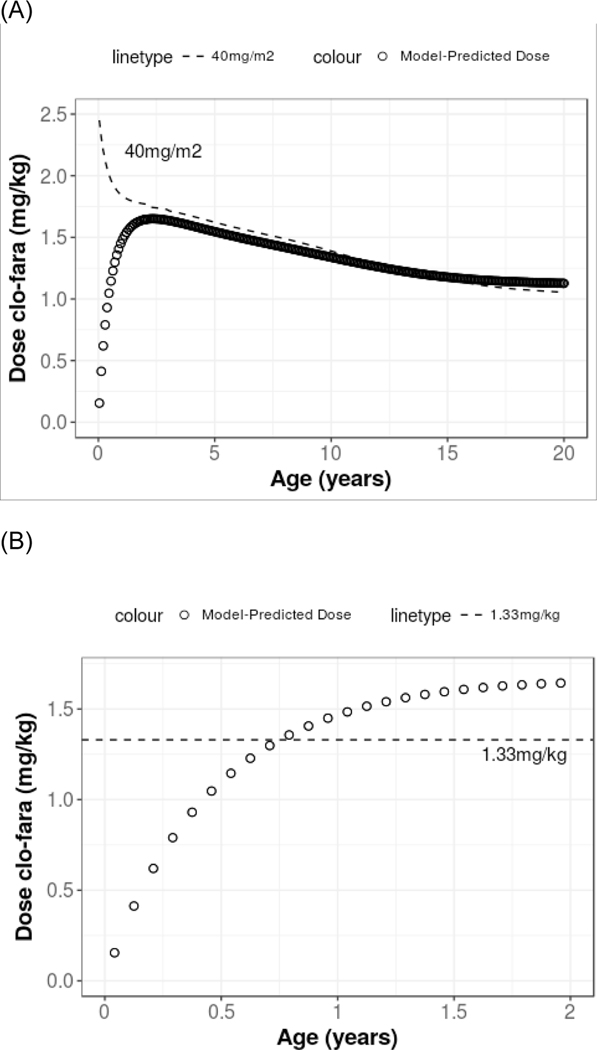
The primary objective of this work was to characterize the pharmacokinetics (PK) of systemic clofarabine (clo-fara) in pediatric allogeneic hematopoietic cell transplantation (HCT) recipients receiving either nucleoside monotherapy or a dual nucleoside analog preparative regimen. Fifty-one children (median age, 4.9 years; range, .25 to 14.9 years) undergoing allogeneic HCT for a variety of malignant and nonmalignant disorders underwent PK assessment. Plasma samples were collected over the 4 to 5 days of clo-fara treatment and quantified for clo-fara, using a validated liquid chromatography/tandem mass spectrometry assay. Nonlinear mixed-effects modeling was used to develop the population PK model, including identification of covariates that influenced drug disposition. In agreement with previously published models, a 2-compartment PK model with first-order elimination best described the PK of clo-fara. Final parameter estimates for clo-fara were consistent with previous reports and were as follows: clearance (CL), 23 L/h/15 kg; volume of the central compartment, 42 L/15 kg; volume of peripheral compartment, 47 L/15 kg; and intercompartmental CL, 9.8 L/h/15 kg. Unexplained variability was acceptable at 33%, and the additive residual error (reflective of the assay) was estimated to be 0.36 ng/mL. Patient-specific factors significantly impacting clo-fara CL included actual body weight and age. The covariate model was able to estimate clo-fara CL with good precision in children spanning a wide age range from infancy to early adulthood and demonstrates the need for variable dosing in children of different ages. For example, the dose required for a 6-month and 1-year old was approximately 43% and 17% lower, respectively, than the typical 40 mg/m2dose to achieve the median AUC0-24of 1.04 mg·h/L in the study population. Despite the known renal elimination of clo-fara, no significant clinical parameters for renal function were retained in the final model (P> .05). Coadministration of fludarabine with clo-fara did not alter the CL of clo-fara (P> .05). These results will help inform individualized dosing strategies for clo-fara to improve clinical outcomes and limit drug-related adverse events in children undergoing HCT.
Keywords: Allogeneic; Clofarabine; Fludarabine; Hematopoietic cell transplantation; Pediatric; Pharmacokinetics.
Copyright © 2019 American Society for Blood and Marrow Transplantation. Published by Elsevier Inc. All rights reserved.
Conflict of interest statement
CONFLICT OF INTEREST
We have no conflict of interest to disclose.
Figures
Similar articles
-
Population pharmacokinetics of clofarabine for allogeneic hematopoietic cell transplantation in paediatric patients.Br J Clin Pharmacol. 2021 Aug;87(8):3218-3226. doi: 10.1111/bcp.14738. Epub 2021 Feb 1. Br J Clin Pharmacol. 2021. PMID: 33444472 Free PMC article.
-
Pharmacokinetics and Model-Based Dosing to Optimize Fludarabine Therapy in Pediatric Hematopoietic Cell Transplant Recipients.Biol Blood Marrow Transplant. 2017 Oct;23(10):1701-1713. doi: 10.1016/j.bbmt.2017.06.021. Epub 2017 Jul 3. Biol Blood Marrow Transplant. 2017. PMID: 28684371 Free PMC article. Clinical Trial.
-
Pharmacokinetics of Briquilimab as a Conditioning Agent for Hematopoietic Stem Cell Transplantation in Patients With Severe Combined Immunodeficiency, Myelodysplastic Syndrome, or Acute Myeloid Leukemia.Transplant Cell Ther. 2024 Sep;30(9):923.e1-923.e9. doi: 10.1016/j.jtct.2024.07.001. Epub 2024 Jul 6. Transplant Cell Ther. 2024. PMID: 38972509 Clinical Trial.
-
Alloreactivity as therapeutic principle in the treatment of hematologic malignancies. Studies of clinical and immunologic aspects of allogeneic hematopoietic cell transplantation with nonmyeloablative conditioning.Dan Med Bull. 2007 May;54(2):112-39. Dan Med Bull. 2007. PMID: 17521527 Review.
-
Pharmacokinetics of high-dose i.v. treosulfan in children undergoing treosulfan-based preparative regimen for allogeneic haematopoietic SCT.Bone Marrow Transplant. 2008 Oct;42 Suppl 2:S67-70. doi: 10.1038/bmt.2008.287. Bone Marrow Transplant. 2008. PMID: 18978748 Review.
Cited by
-
Population pharmacokinetics of clofarabine for allogeneic hematopoietic cell transplantation in paediatric patients.Br J Clin Pharmacol. 2021 Aug;87(8):3218-3226. doi: 10.1111/bcp.14738. Epub 2021 Feb 1. Br J Clin Pharmacol. 2021. PMID: 33444472 Free PMC article.
-
Effect of clofarabine and fludarabine exposure on outcome after pediatric allogeneic hematopoietic cell transplantation.Blood Neoplasia. 2024 Jul 17;1(3):100030. doi: 10.1016/j.bneo.2024.100030. eCollection 2024 Sep. Blood Neoplasia. 2024. PMID: 40548196 Free PMC article. No abstract available.
-
Clofarabine increases the eradication of minimal residual disease of primary B-precursor acute lymphoblastic leukemia compared to high-dose cytarabine without improvement of outcome. Results from the randomized clinical trial 08-09 of the Cooperative Acute Lymphoblastic Leukemia Study Group.Haematologica. 2022 May 1;107(5):1026-1033. doi: 10.3324/haematol.2021.279357. Haematologica. 2022. PMID: 34348455 Free PMC article. Clinical Trial.
-
Therapeutic Drug Monitoring of Conditioning Agents in Pediatric Allogeneic Stem Cell Transplantation; Where do We Stand?Front Pharmacol. 2022 Mar 7;13:826004. doi: 10.3389/fphar.2022.826004. eCollection 2022. Front Pharmacol. 2022. PMID: 35330826 Free PMC article. Review.
-
Quantification of Clofarabine and Fludarabine in Plasma by High-Performance Liquid Chromatography-Tandem Mass Spectrometry.Methods Mol Biol. 2024;2737:175-184. doi: 10.1007/978-1-0716-3541-4_17. Methods Mol Biol. 2024. PMID: 38036821
References
-
- Boelens J-J et al. Combining Clofarabine and Fludarabine with Exposure Targeted Busulfan for Pediatric Leukemia: An Effective, Low Toxicity TBI-Free Conditioning Regimen. Biol. Blood Marrow Transplant 22, S99–S100 (2016).
-
- Bonate PL et al. Discovery and development of clofarabine: a nucleoside analogue for treating cancer. Nat. Rev. Drug Discov 5, 855–863 (2006). - PubMed
-
- Long Boyle J. et al. Pharmacokinetics of Clofarabine in Patients With High-Risk Inherited Metabolic Disorders Undergoing Brain-Sparing Hematopoietic Cell Transplantation. J. Clin. Pharmacol 51, 679–686 (2011). - PubMed
