

Dehydrocrenatidine Inhibits Voltage-Gated Sodium Channels and Ameliorates Mechanic Allodia in a Rat Model of Neuropathic Pain
- PMID: 31003411
- PMCID: PMC6521113
- DOI: 10.3390/toxins11040229
Dehydrocrenatidine Inhibits Voltage-Gated Sodium Channels and Ameliorates Mechanic Allodia in a Rat Model of Neuropathic Pain
Abstract
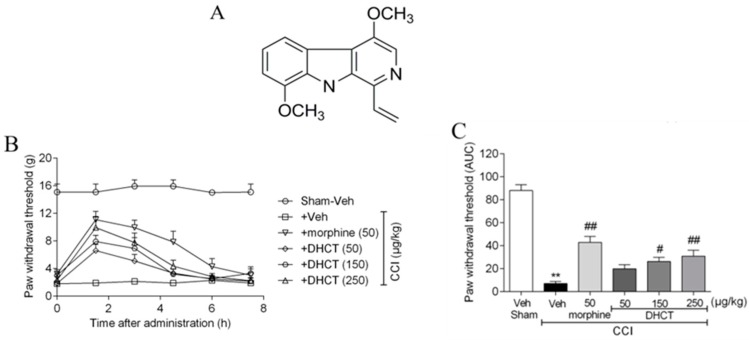
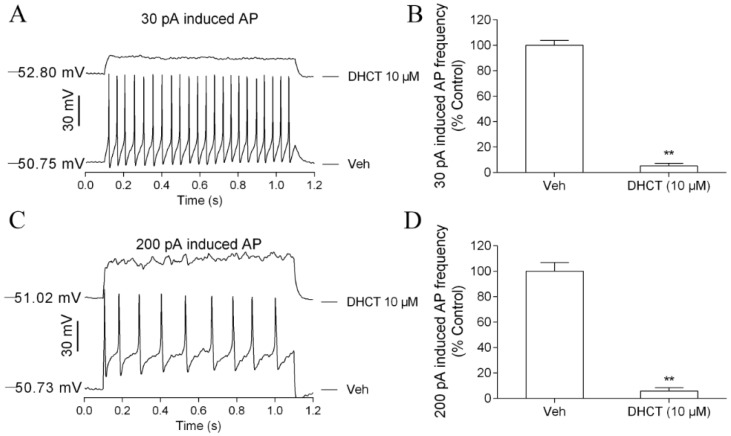
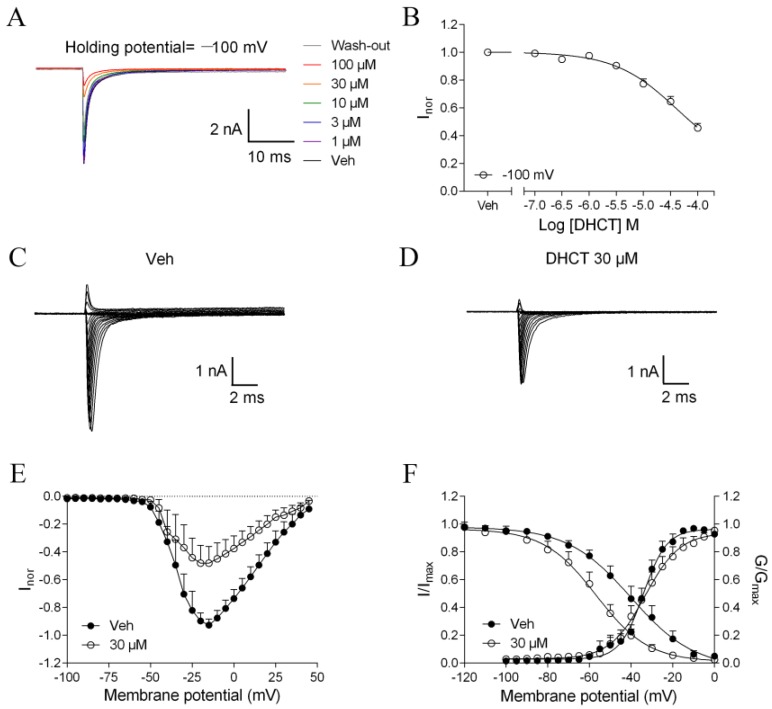
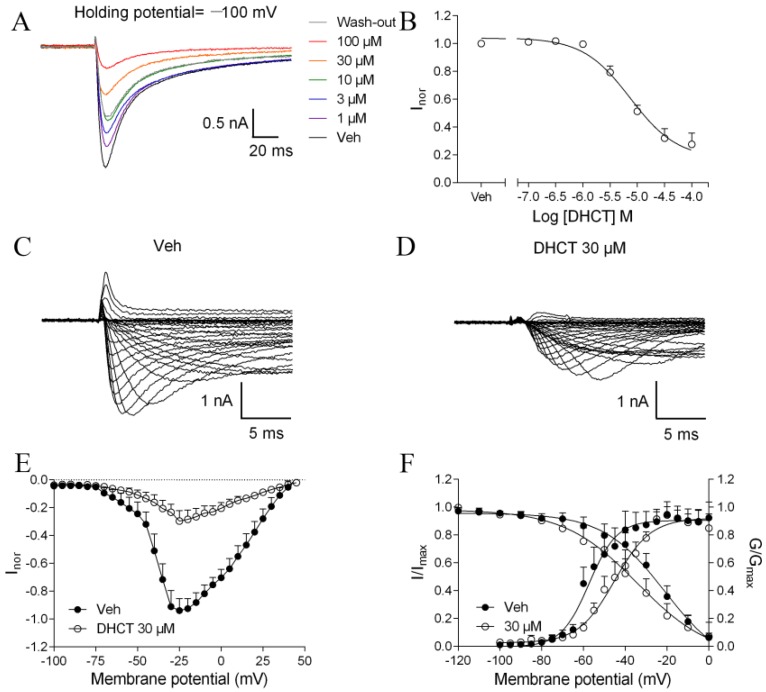
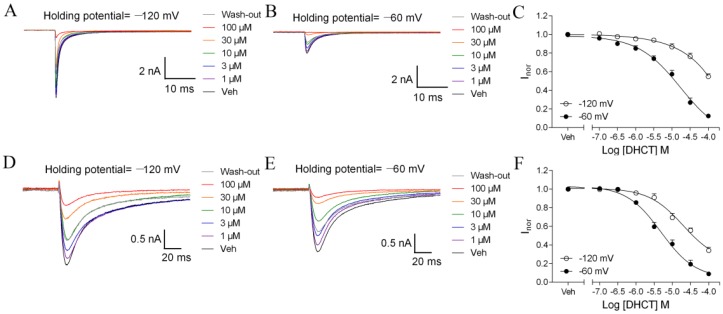
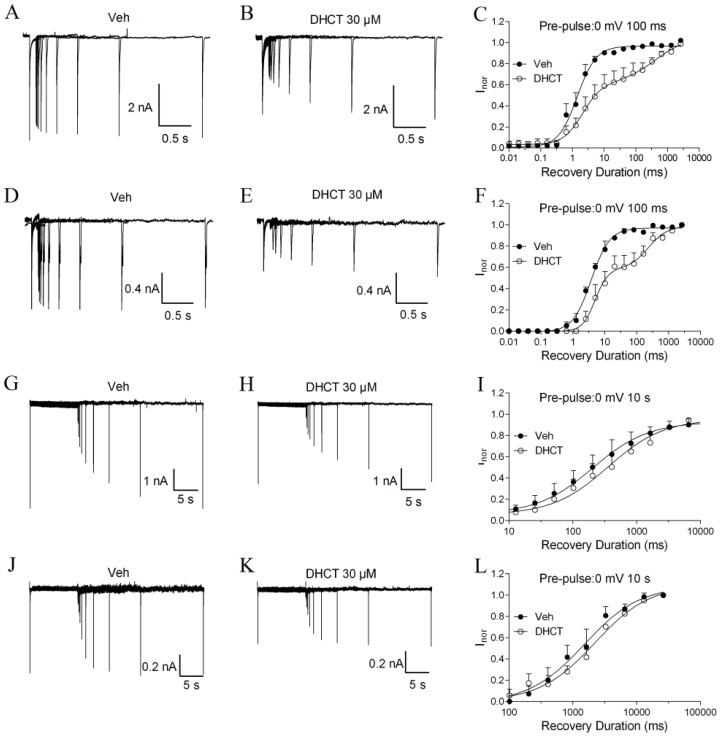
Picrasma quassioides (D. Don) Benn, a medical plant, is used in clinic to treat inflammation, pain, sore throat, and eczema. The alkaloids are the main active components in P. quassioides. In this study, we examined the analgesic effect of dehydrocrenatidine (DHCT), a β-carboline alkaloid abundantly found in P. quassioides in a neuropathic pain rat model of a sciatic nerve chronic constriction injury. DHCT dose-dependently attenuated the mechanic allodynia. In acutely isolated dorsal root ganglion, DHCT completely suppressed the action potential firing. Further electrophysiological characterization demonstrated that DHCT suppressed both tetrodotoxin-resistant (TTX-R) and sensitive (TTX-S) voltage-gated sodium channel (VGSC) currents with IC50 values of 12.36 μM and 4.87 µM, respectively. DHCT shifted half-maximal voltage (V1/2) of inactivation to hyperpolarizing direction by ~16.7 mV in TTX-S VGSCs. In TTX-R VGSCs, DHCT shifted V1/2 of inactivation voltage to hyperpolarizing direction and V1/2 of activation voltage to more depolarizing potential by ~23.9 mV and ~12.2 mV, respectively. DHCT preferred to interact with an inactivated state of VGSCs and prolonged the repriming time in both TTX-S and TTX-R VGSCs, transiting the channels into a slow inactivated state from a fast inactivated state. Considered together, these data demonstrated that the analgesic effect of DHCT was likely though the inhibition of neuronal excitability.
Keywords: dehydrocrenatidine; neuropathic pain; voltage-gated sodium channels.
Conflict of interest statement
Authors declare no conflicts of interest.
Figures
Similar articles
-
Bulleyaconitine A preferably reduces tetrodotoxin-sensitive sodium current in uninjured dorsal root ganglion neurons of neuropathic rats probably via inhibition of protein kinase C.Pain. 2017 Nov;158(11):2169-2180. doi: 10.1097/j.pain.0000000000001018. Pain. 2017. PMID: 28915149
-
A-887826 is a structurally novel, potent and voltage-dependent Na(v)1.8 sodium channel blocker that attenuates neuropathic tactile allodynia in rats.Neuropharmacology. 2010 Sep;59(3):201-7. doi: 10.1016/j.neuropharm.2010.05.009. Epub 2010 Jun 1. Neuropharmacology. 2010. PMID: 20566409
-
Comparative evaluation of in vitro and in vivo high glucose-induced alterations in voltage-gated tetrodotoxin-resistant sodium channel: Effects attenuated by sodium channel blockers.Neuroscience. 2015 Oct 1;305:183-96. doi: 10.1016/j.neuroscience.2015.07.085. Epub 2015 Aug 6. Neuroscience. 2015. PMID: 26255676
-
Tetrodotoxin, a Potential Drug for Neuropathic and Cancer Pain Relief?Toxins (Basel). 2021 Jul 12;13(7):483. doi: 10.3390/toxins13070483. Toxins (Basel). 2021. PMID: 34357955 Free PMC article. Review.
-
Tetrodotoxin (TTX) as a therapeutic agent for pain.Mar Drugs. 2012 Feb;10(2):281-305. doi: 10.3390/md10020281. Epub 2012 Jan 31. Mar Drugs. 2012. PMID: 22412801 Free PMC article. Review.
Cited by
-
Progress in the study of chemical composition, biological activity, and its metabolism of the Picrasma quassioides.Heliyon. 2024 Aug 3;10(15):e35761. doi: 10.1016/j.heliyon.2024.e35761. eCollection 2024 Aug 15. Heliyon. 2024. PMID: 39170506 Free PMC article. Review.
-
Screening an In-House Isoquinoline Alkaloids Library for New Blockers of Voltage-Gated Na+ Channels Using Voltage Sensor Fluorescent Probes: Hits and Biases.Molecules. 2022 Jun 28;27(13):4133. doi: 10.3390/molecules27134133. Molecules. 2022. PMID: 35807390 Free PMC article.
-
Exploring Medicinal Herbs' Therapeutic Potential and Molecular Docking Analysis for Compounds as Potential Inhibitors of Human Acetylcholinesterase in Alzheimer's Disease Treatment.Medicina (Kaunas). 2023 Oct 12;59(10):1812. doi: 10.3390/medicina59101812. Medicina (Kaunas). 2023. PMID: 37893530 Free PMC article.
-
Scorpion Neurotoxin Syb-prII-1 Exerts Analgesic Effect through Nav1.8 Channel and MAPKs Pathway.Int J Mol Sci. 2022 Jun 25;23(13):7065. doi: 10.3390/ijms23137065. Int J Mol Sci. 2022. PMID: 35806068 Free PMC article.
-
Dehydrocrenatidine Induces Liver Cancer Cell Apoptosis by Suppressing JNK-Mediated Signaling.Pharmaceuticals (Basel). 2022 Mar 25;15(4):402. doi: 10.3390/ph15040402. Pharmaceuticals (Basel). 2022. PMID: 35455398 Free PMC article.
References
Publication types
MeSH terms
Substances
LinkOut - more resources
Full Text Sources
