. 2019 Apr 18;20(8):1916.
doi: 10.3390/ijms20081916.

PMN-MDSCs Enhance CTC Metastatic Properties through Reciprocal Interactions via ROS/Notch/Nodal Signaling

Affiliations

PMN-MDSCs Enhance CTC Metastatic Properties through Reciprocal Interactions via ROS/Notch/Nodal Signaling

Marc L Sprouse et al. Int J Mol Sci. .

Abstract

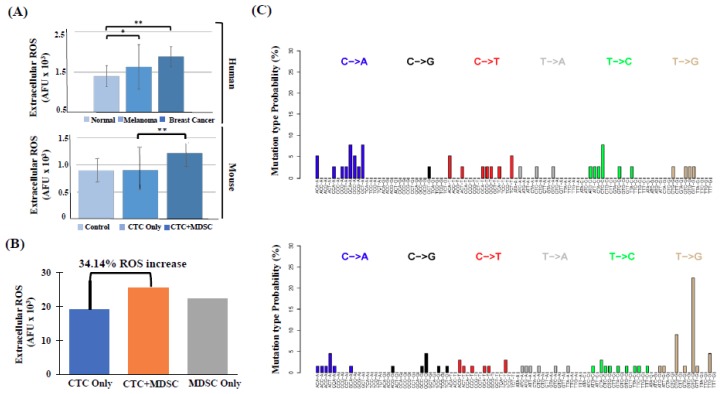
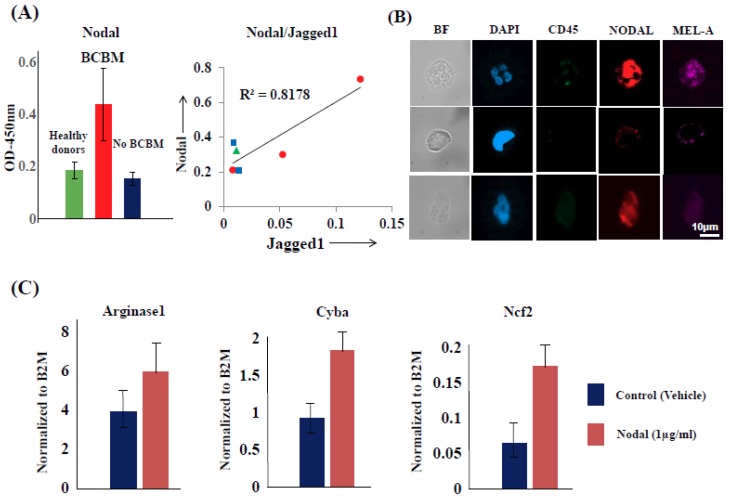
Intratumoral infiltration of myeloid-derived suppressor cells (MDSCs) is known to promote neoplastic growth by inhibiting the tumoricidal activity of T cells. However, direct interactions between patient-derived MDSCs and circulating tumors cells (CTCs) within the microenvironment of blood remain unexplored. Dissecting interplays between CTCs and circulatory MDSCs by heterotypic CTC/MDSC clustering is critical as a key mechanism to promote CTC survival and sustain the metastatic process. We characterized CTCs and polymorphonuclear-MDSCs (PMN-MDSCs) isolated in parallel from peripheral blood of metastatic melanoma and breast cancer patients by multi-parametric flow cytometry. Transplantation of both cell populations in the systemic circulation of mice revealed significantly enhanced dissemination and metastasis in mice co-injected with CTCs and PMN-MDSCs compared to mice injected with CTCs or MDSCs alone. Notably, CTC/PMN-MDSC clusters were detected in vitro and in vivo either in patients' blood or by longitudinal monitoring of blood from animals. This was coupled with in vitro co-culturing of cell populations, demonstrating that CTCs formed physical clusters with PMN-MDSCs; and induced their pro-tumorigenic differentiation through paracrine Nodal signaling, augmenting the production of reactive oxygen species (ROS) by PMN-MDSCs. These findings were validated by detecting significantly higher Nodal and ROS levels in blood of cancer patients in the presence of naïve, heterotypic CTC/PMN-MDSC clusters. Augmented PMN-MDSC ROS upregulated Notch1 receptor expression in CTCs through the ROS-NRF2-ARE axis, thus priming CTCs to respond to ligand-mediated (Jagged1) Notch activation. Jagged1-expressing PMN-MDSCs contributed to enhanced Notch activation in CTCs by engagement of Notch1 receptor. The reciprocity of CTC/PMN-MDSC bi-directional paracrine interactions and signaling was functionally validated in inhibitor-based analyses, demonstrating that combined Nodal and ROS inhibition abrogated CTC/PMN-MDSC interactions and led to a reduction of CTC survival and proliferation. This study provides seminal evidence showing that PMN-MDSCs, additive to their immuno-suppressive roles, directly interact with CTCs and promote their dissemination and metastatic potency. Targeting CTC/PMN-MDSC heterotypic clusters and associated crosstalks can therefore represent a novel therapeutic avenue for limiting hematogenous spread of metastatic disease.

Keywords: Heterotypic CTC clusters; biomarkers and signaling pathways; breast cancer; circulating tumor cells (CTCs); melanoma; mutual CTC/PMN-MDSC activation cycle; polymorphonuclear-myeloid derived suppressor cells (PMN-MDSCs).


Conflict of interest statement

The authors declare no conflict of interest.

Figures

Figure 1
Figure 1
(A,B) The detection of heterotypic CTC clusters using CellSearch® analyses of blood obtained from melanoma or breast cancer patients, respectively. (C) Representative images capturing a two-cell heterotypic cluster between one CTC and one cell of the myeloid lineage (top), and a homotypic CTC/CTC cluster (bottom) using CellSieve™ cell filtration device. (D) Detection of large heterotypic CTC clusters using the Parsortix® filtration device from blood of melanoma and breast cancer patients. Representative images are shown. Red arrows point out to MelA/CD146-positive cells (melanoma CTCs) or EpCAM/PanCK-positive cells (breast cancer CTCs), respectively. (E) Representative images of melanoma patient CTC/PMN-MDSC heterotypic clusters captured by Parsortix® microfluidic device. Heterotypic clusters between FACS-sorted Lin−/CD45−/MelA+/CD146+ cells (melanoma CTCs) and Lin+/CD45+/CD33+/CD15+ cells (melanoma PMN-MDSCs) from a representative patient are shown. White arrows point to CTCs. Scale bar = 20 μm.
Figure 2
Figure 2
Circos plot of the somatic genetic variants detectable in Lin-/DAPI+/EpCAM+/CK+ CTCs (outer layer), and Lin+/DAPI+/CD14+ (middle layer), and Lin+/DAPI+/CD15+ (inner layer) cell populations selected from blood of a metastatic breast cancer patient via multi-parametric FACS.
Figure 3
Figure 3
Metastatic competence of CTCs is significantly enhanced by co-transplantation of PMN-MDSCs isolated from the same patient in animals. (A) Representative images of mice injected intracardiacally with luciferase-labeled MDA-MB-231BR cells (Brc-Luc) cells, either alone or with unlabeled PMN-MDSCs (1.0 × 10³ Brc-Luc cells vs. 5.0 × 10⁵ PMN-MDSCs), followed by bioluminescence imaging at indicated times. Bioluminescence measurements of metastasis/BCBM per treatment of mice populations (n = 10/subgroup; * p < 0.05). (B) Detection of FACS-selected patient-derived CTCs (Lin−/DAPI+/CD146+/MelA+ cells) and PMN-MDSCs (Lin-/DAPI+/CD33+/CD15+ cells) obtained from blood of a representative melanoma patient injected in humanized mice, either alone (CTC Alone/PMN-MDSC Alone), or together (CTC + PMN-MDSC) (1.0 × 10³ CTCs, vs. 5.0 × 10⁵ PMN-MDSCs). Data show the percentage of live human melanoma CTCs (Lin−/CD146+/MelA+ cells) isolated from humanized murine blood 22 weeks following cell injection. Data represent the mean ± SD of six independent experiments (n = 6).
Figure 4
Figure 4
The detection of bioluminescence signal following the injection of human brain-metastatic breast cancer (MDA-MB-231BR) (A) (red circles refer to the detection of brain metastasis in mice) or melanoma (70W-SM3) mice (B) cells with or without co-transplantation with circulatory PMN-MDSCs isolated from blood of respective patients. Representative animals are shown (n = 3/subgroup; * p < 0.001). (C) CTC metastatic competence is increased by PMN-MDSCs. Patient-isolated CTCs were injected together with PMN-MDSCs derived from respective breast cancer or melanoma patient blood via intra-cardiac route. Following animal euthanization and tissue organ processing, tumor cells were detected in metastatic foci by histopathology staining using human tumor cell-specific markers as indicated. Animal lung tissues of four breast cancer or melanoma patients were analyzed following the injection of CTCs/PMN-MDSCs. Magnified images (100×) were captured and quantified by free-access Image J software using the reciprocal intensity (250-y) method [22]. Controls consisted of detection of human tumor cells in tissues of animals injected only with CTCs. Tissues of animals injected only with patients’ MDSCs stained negative for human tumor cell-specific biomarkers (data not shown).
Figure 5
Figure 5
(A) The detection of significantly higher exogenous ROS levels in serum of breast cancer or melanoma patients compared to healthy donors (Normal) (n = 4; * p < 0.01; **p < 0.001) (Upper panel); or in serum of animals previously (6 days) injected with CTCs + PMN-MDSCs directly isolated from patients’ blood in parallel vs. CTC alone vs. no cell injection (Control) (n = 4; ** p < 0.001). (B) CTC/PMN-MDSC co-cultures contributed to significantly higher extracellular ROS (~35% increase; p < 0.001). CTCs/PMN-MDSCs from co-cultures were injected in mice and ROS levels compared to ones from mice injected with either CTCs or MDSCs alone (n = 8/subgroup). (C) Mutational signatures of M-MDSC (Lin+/DAPI+/CD33+/CD14+ (upper panel)) and PMN-MDSC (Lin+/DAPI+/CD33+CD15+ (lower panel)) cell populations by WES analyses.
Figure 6
Figure 6
Patient-isolated PMN-MDSCs interact with and promote CTC proliferation. (A) CTCs and PMN-MDSCs isolated from blood of BCBM patients were co-cultured over time and their growth was monitored by IncuCyte® S3 Live-Cell Analysis System. Snap-shots were taken at indicated times using IncuCyte® real-time videomicroscopy. Yellow arrows point out to specific CTC/PMN-MDSC interactions. (B) Heterotypic clusters formation between CTCs and PMN-MDSCs detected over time (>72 h) by IncuCyte® following CTC/PMN-MDSC co-culturing. CTCs were labeled green using Vybrant™ DiO cell-labeling solution (Molecular Probes, Inc., Eugene, OR, USA), and clusters were visualized (yellow circles) and analyzed for CTCs and PMN-MDSCs presence. A >10-fold multiplication of CTC numbers could be detected when clustered with PMN-MDSCs. (C) CTC/PMN-MDSC clusters were retrieved from co-cultures employing CellCelector™ (ALS, Inc., Jena, Germany), dissociated into single-cell suspensions, stained for specific markers, and analyzed by the DEPArray. Representative images of single CTCs and PMN-MDSCs from the same patient are shown. BF = Brightfield image. (D) Transcriptomic analyses of CTCs retrieved from CTC/PMN-MDSC clusters following co-cultures vs. CTCs alone. Highest expression of genes related to cell cycle progression and Notch1 targets are shown. Dissociated cells from CTC/PMN-MDSC clusters were collected directly into a pre-chilled tube maintained at 4 °C containing RNA lysis buffer. Total RNA was collected according to the manufacturer’s protocol (Macherey-Nagel, Inc., Düren, Germany). Subsequently, RNA and cDNA amplifications, quality controls and gene expression arrays were performed at the Sequencing and Non-coding RNA Program Core (MD Anderson Cancer Center, Houston, TX, USA) using the HTA 2.0 gene chip (Affymetrix, Inc., Santa Clara, CA, USA). Subsequent pathway enrichment analysis was performed using the Ingenuity pathway software (IPA version 01–07; Qiagen, Inc., Hilden, Germany), as previously described [3].
Figure 7
Figure 7
(A) Dose-dependent increase of NRF2 target genes in melanoma CTCs following H2O2 treatment. Data from a representative experiment (n = 4) are shown. (B) Augmented gene expression of Notch1 ligands Jagged1 and DLL4 in PMN-MDSCs isolated from patients with/without brain metastasis (BM). HD = corresponding analyses of PMN-MDSCs isolated from blood of healthy donors. (C) CTC proliferation is up-regulated by the combinatorial treatment of oxidative stress and MDSC Jagged1 measured by real-time IncuCyte® Live-Cell Analysis System in 3D cell conditions. No treatment (negative control; black), H2O2 (25 μM; red), recombinant human Jagged1 (100 μM; yellow), and combinatorial (orange) are shown. Data are representative of six independent experiments (n = 6).
Figure 8
Figure 8
(A) Significant Nodal expression in serum of BCBM patients vs. patients with No BCBM but diagnosed with metastasis to other organs vs. healthy donors (Left panel). High correlation (R2 = 0.8178) between BCBM Nodal and PMN-MDSC Jagged1 expression in the same patient cohort type (Right panel). (B) Nodal expression positivity/heterogeneity in CTCs isolated from blood of melanoma patients by FACS. Staining was performed employing high-definition immunofluorescence (IF) microscopy, as previously described [3]. (C) Increased expression of Arginase1, Cyba, and Ncf2 gene expression by treatment of PMN-MDSCs with recombinant human Nodal (1 μg/mL) [35]. B2M = Beta 2 microglobin (control). Data shown are mean ± SD of four independent experiments (n = 4).
Figure 9
Figure 9
(A) Detection of Cripto/Jagged1 over-expression in PMN-MDSCs isolated from blood of BCBM patients by FACS followed by high-definition immunofluorescence (IF) microscopy. Single-cell images of a representative experiment (n = 4) are shown. (B) Co-cultures of CTCs with PMN-MDSCs isolated from BCBM patients not treated (red), or treated with Nodal inhibitor Lefty (green). CTCs (blue) or PMN-MDSCs cultured alone (grey, at baseline) represent negative controls. Data are mean ± SD of four independent experiments (n = 4). (C) Red frame shows PMN-MDSC transdifferentiation/phenotypic changes induced following co-culture with CTCs isolated from the same patient; however, changes were abrogated by incubation with Nodal inhibitor Lefty (1 µg/mL for 96 h at 37 °C) [34]. Ratios between CD11b+/SSC-A and CD11b+/SSC-A low are shown in a representative experiment (n = 4).
Figure 10
Figure 10
Model outlining biomarkers and pathways between CTCs and PMN-MDSCs interactions (CTC/PMN-MDSC cluster) isolated from blood of metastatic cancer patients. Large red arrow shows PMN-MDSC-secreted ROS affecting CTC-associated Nrf2/Notch1/Nodal pathway. Small black arrows refer to induction of CTC Nrf2-ARE, Notch1 and Nodal gene expression, respectively.

Similar articles

Cited by

References

    1. Giuliano M., Shaikh A., Lo H.C., Arpino G., de Placido S., Xiang H., Zhang X.H., Cristofanilli M., Schiff R., Trivedi M.V. Perspective on Circulating Tumor Cell Clusters: Why it takes a village to metastasize. Cancer Res. 2018;78:845–852. doi: 10.1158/0008-5472.CAN-17-2748. - DOI - PubMed
    1. Aceto N., Bardia A., Miyamoto D.T., Donaldson M.C., Wittner B.S., Spencer J.A., Yu M., Pely A., Engstrom A., Zhu H., et al. Circulating tumor cell clusters are oligoclonal precursors of breast cancer metastasis. Cell. 2014;158:1110–1122. doi: 10.1016/j.cell.2014.07.013. - DOI - PMC - PubMed
    1. Boral D., Vishnoi M., Liu H.N., Yin W., Sprouse M.L., Scamardo A., Hong D.S., Tan T.Z., Thiery J.-P., Chang J.C., et al. Molecular characterization of breast cancer CTCs associated with brain metastasis. Nat. Commun. 2017;8:196–206. doi: 10.1038/s41467-017-00196-1. - DOI - PMC - PubMed
    1. Gabrilovich D.I. Myeloid-derived suppressor cells. Cancer Immunol. Res. 2017;5:3–8. doi: 10.1158/2326-6066.CIR-16-0297. - DOI - PMC - PubMed
    1. Gabrilovich D.I., Nagaraj S. Myeloid-derived suppressor cells as regulators of the immune system. Nat. Rev. Immunol. 2009;9:162–174. doi: 10.1038/nri2506. - DOI - PMC - PubMed

MeSH terms