Review
. 2019 Apr 18;8(4):361.
doi: 10.3390/cells8040361.

Quantitative Analysis of Nuclear Lamins Imaged by Super-Resolution Light Microscopy

Affiliations
Review

Quantitative Analysis of Nuclear Lamins Imaged by Super-Resolution Light Microscopy

Mark Kittisopikul et al. Cells. .

Abstract

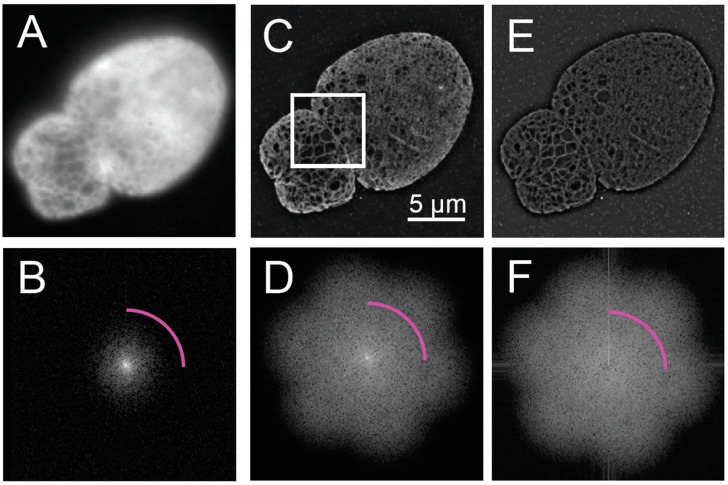
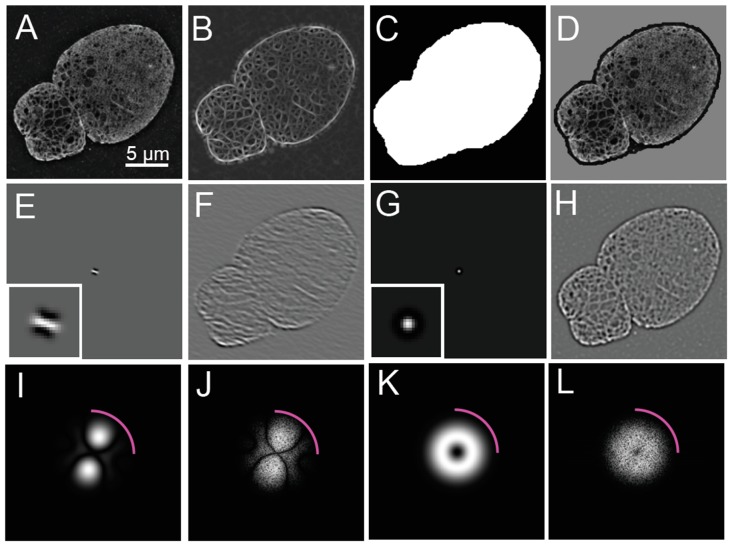
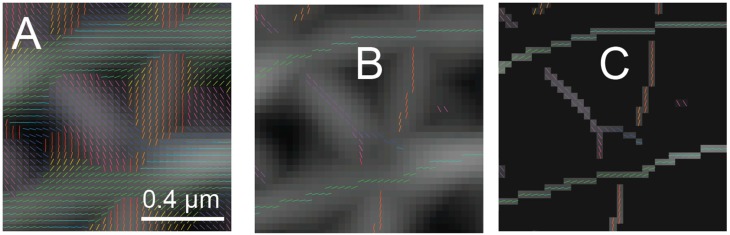
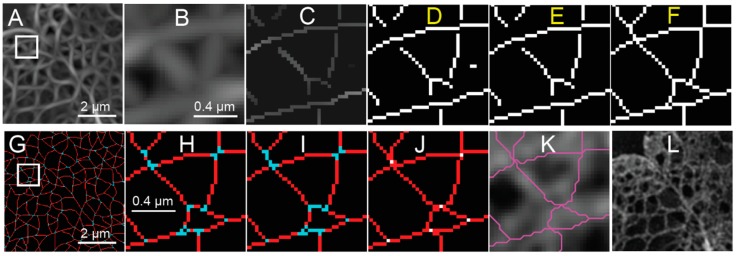
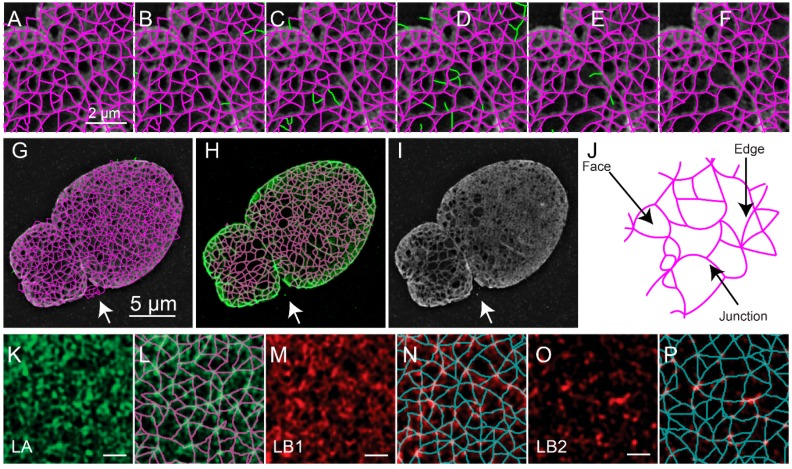
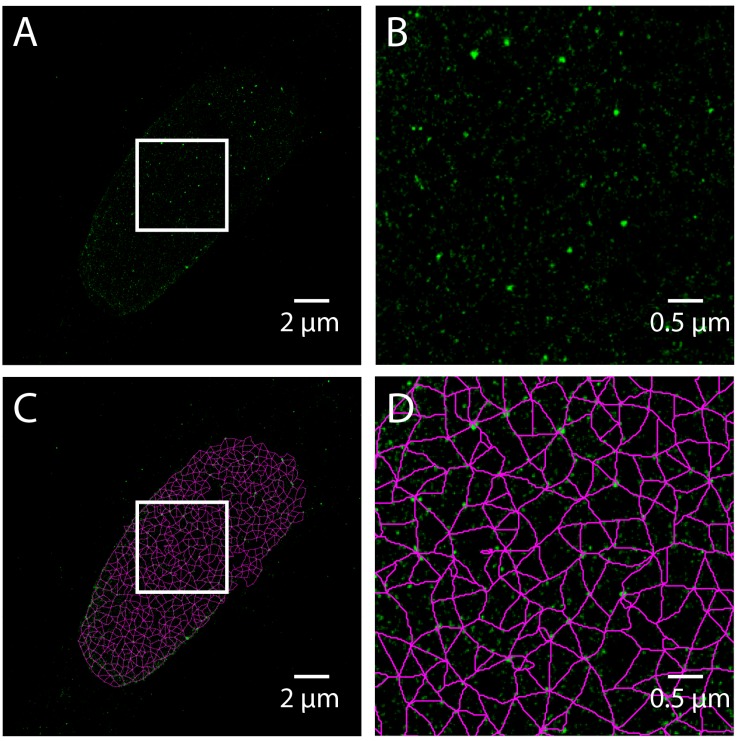
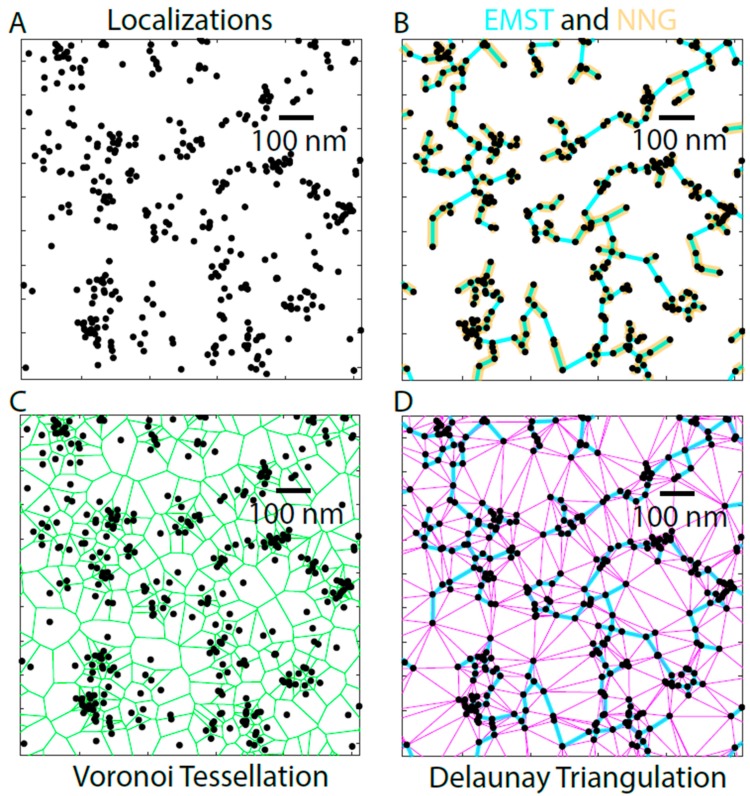
The nuclear lamina consists of a dense fibrous meshwork of nuclear lamins, Type V intermediate filaments, and is ~14 nm thick according to recent cryo-electron tomography studies. Recent advances in light microscopy have extended the resolution to a scale allowing for the fine structure of the lamina to be imaged in the context of the whole nucleus. We review quantitative approaches to analyze the imaging data of the nuclear lamina as acquired by structured illumination microscopy (SIM) and single molecule localization microscopy (SMLM), as well as the requisite cell preparation techniques. In particular, we discuss the application of steerable filters and graph-based methods to segment the structure of the four mammalian lamin isoforms (A, C, B1, and B2) and extract quantitative information.

Keywords: computational geometry; delaunay triangulation; lamins; single molecule localization microscopy; steerable filters; structured illumination microscopy; voronoi tessellation.


Conflict of interest statement

The authors declare no conflict of interest. The funders had no role in the design the study; in the collection, analyses, or interpretation of the data; in the writing of the manuscript, or in the decision to publish the results.

Figures

Figure 1
Figure 1
Structured Illumination Microscopy and Reconstruction of an Image of Lmnb1−/− Mouse Embryonic Fibroblast. Fifteen frames, consisting of three angles and five orientations, for a 3D-Structured Illumination Microscopy (SIM) image were acquired of the nucleus of a Lmnb1−/− mouse embryonic fibroblast (MEF) as part of a z-stack. The frames from a single z-slice were averaged to produce a widefield image (A) and the two-dimensional Fourier transform of the widefield image (B), showing the diffraction-limited resolution of widefield microscopy. The fifteen frames were processed into a reconstructed 3D-SIM image (C) and its two-dimensional Fourier transform (D). The ratio of (C) over (A) is computed by pixel-by-pixel division to show contrast enhancement of features in structured illumination microscopy (SIM) over widefield microscopy along with its two-dimensional Fourier Transform (F) of (E), showing retention of structural coefficients with reduced low frequency contribution. Magenta arcs in (B), (D), and (F) indicate resolution cut-off limit at 250 nanometers. Fourier Transforms are shown as a log (magnitude+1). The white scale bar indicates 5 micrometers. The white box in (C) is the area analyzed in Figure 4 A. The figure has been adapted from portions of Shimi and Kittisopikul et al.
Figure 2
Figure 2
Steerable Filter Properties and Initial Application to a Reconstructed Image of a SIM Image of a Lmnb1−/− MEF. (A) For reference, the reconstructed 3D-SIM image of a Lmnb1−/− mouse embryonic fibroblast (MEF) nucleus is redisplayed from Figure 1C. (B) The image obtained after a steerable filter bank was applied to the image shown in (A). From the steerable filter response, a nucleus mask (C) was created by thresholding and morphological processing. To demonstrate that the nucleus was contained within the mask, the multiplicative product (D) of the reconstructed image (A) in the binary mask (C) is shown. To illustrate the process in more detail, a steerable filter orientated at 140 degrees (E) is shown in the image domain with an inset showing the filter magnified by five times. The grey background indicates zero-level, while black indicates the negative portion of the filter. When the steerable filter (E) was applied to the reconstructed image of the Lmnb1−/− MEF nucleus (A), the response (F) indicates how well the image matches the oriented filter. Steerable filters were averaged over all orientation angles to produce the average filter (G) with the inset showing the averaged filter magnified by five times. The grey background indicates zero-level while black indicates the negative portion of the filter. The averaged filter (G) was applied to the reconstructed image (A) to produce an averaged steerable response (H), enhancing the areas matching the scale selective bandpass of the averaged filter. Two-dimensional Fourier transforms (2DFT) of (E), (F), (G), and (H) are shown in (I), (J), (K), and (L), respectively. The 2DFT of the oriented filter (I) and averaged filter (K) shows the scale and orientation selectivity in the Fourier domain. In the Fourier domain, the application of the oriented and averaged filters is a pointwise product of (I) and Figure 1D, resulting in (J) a pixel-wise product of (K), and Figure 1D, resulting in (L) due to the convolution theorem. Magenta arcs in (I-L) indicate widefield resolution cut-off limit shown at 250 nm as shown in in Figure 1. Fourier Transforms are shown as a log (magnitude+1). The white scale bar indicates 5 micrometers.
Figure 3
Figure 3
Orientation Detection and Non-Maximum Suppression of Steerable Filter Response of a SIM Image of a Lmnb1−/− MEF. The orientation corresponding to the maximum response (argmax) of steerable filter bank (A) is overlaid on the maximum response value image as shown in Figure 2B. The orientation is indicated both by the slope of the lines drawn and their color according to an Hue-Saturation-Value (HSV) color map. Non-maximum suppression (NMS) is applied to the orientation indicators (B). The orientation indicators are only shown if the steerable filter response is larger than the interpolated values in either direction perpendicular to the orientation. The non-maximum suppression (NMS) is then applied to the maximum response (C) and orientation indicators (B). Response values are set to zero unless the steerable filter response is larger than the interpolated values in either direction perpendicular to the orientation. The white scale bar indicates 0.4 micrometers. The figure has been adapted from portions of Shimi and Kittisopikul et al.
Figure 4
Figure 4
Pixel Based Processing of Steerable Filter Response and Non-Maximum Suppression to Form the Initial Meshwork Structure from a SIM Image of a Lmnb1−/− MEF. The maximum steerable filter response (A) of the area indicated in Figure 1C of a reconstructed image of the Lmnb1−/− MEF nucleus is shown. The area indicated by white box of (A) is magnified by five times (B). Non-maximum suppression (NMS) is then applied (C) to the maximum steerable filter response (A). The NMS (C) is then binarized such that non-zero pixels are indicated as white pixels to create a binarized image with line segments (D). Short segments of less than five pixels are removed from the binarized skeleton (E). The endpoints of line segments are extended until meeting another segment (F). Pixels in the extended binarized skeleton (F) for the area shown in Panel A are classified as either morphological edges (red) or branch points (cyan) (G). The area indicated by the white box of Panel G is magnified five times (H). Short segments between branch points are reclassified (F) as being part of a junction (cyan). The centroids of connected junctions (white) are identified (J) and the end points of edges are extended to them using the Bresenham line drawing algorithm (red). Edges are drawn as magenta lines and overlaid on reconstructed image of a reconstructed Lmnb1−/− MEF (K). For comparison, the reconstructed fluorescence intensity image of the same area illustrated in (A) and (G) before processing is shown in (L). The white scale bar indicates two micrometers (A, G, L) or 0.4 micrometers (B–F, H–K). The figure has been adapted from portions of Shimi and Kittisopikul et al.
Figure 5
Figure 5
Edge and Face Based Auditing of Meshwork Structure of a SIM Image of a Lmnb1−/− MEF. Unaudited edges are drawn as magenta lines over reconstructed image of the region in the white box indicated in Figure 1C (A). Edges are audited in a multistep process to remove edges which do not match features in the reconstructed image. First, edges (green) are removed due to the edges not matching the ratio image based on a distance weighted intensity measurement (B). Then, edges (green) are removed since either the minimum intensity, mean intensity, or normalized range of intensities in the reconstructed image (Figure 1C) do not meet thresholds described in the text (C). Next, edges (green) are removed since the edges do not sufficiently overlap the ratio image (Figure 1E) above an Otsu threshold (D). Finally, edges (green) are removed (E) since the new areas that result, faces as in (J) would better match the ratio image based on a distance weighted intensity measurement (F). These steps result in an audited meshwork shown in magenta (F). A zoomed-out view (G) of the entire unaudited meshwork is drawn as magenta lines over the reconstructed image. Green lines in (G) indicate edges not adjacent to faces being removed in early auditing steps. The audited meshwork drawn as magenta lines is superimposed on the reconstructed image intensity in green (H). The reconstructed image intensity as in Figure 1C is shown for comparison (I). The meshwork results in faces, edges, and junctions (J), whose properties have been quantified for further analysis [10]. Edges are lines tracing fibers of the nuclear lamina. Junctions are lines where multiple edges meet. Faces are enclosed areas surrounded by edges. The meshwork analysis has been applied to 3D-SIM images in dense Lamin A (K,L), Lamin B1 (M,N), and Lamin B2 (O,P) [10]. The white scale bar indicates two micrometers (A–F), five micrometers (G–I), or one micrometer (K–P). The figure has been adapted from portions of Shimi and Kittisopikul et al.
Figure 6
Figure 6
Steerable Filter Based Meshwork Analysis of a Total Internal Reflection Fluorescence – Stochastic Optical Reconstruction Microscopy (TIRF-STORM) Image of a normal Human Skin Fibroblast. TIRF-STORM image of Lamin A labeled human dermal fibroblast is rendered by binning fluorophore coordinates into a 20 nm pixel grid (A). The area in the white box (A) is magnified by four times (B). The steerable filter meshwork analysis as detailed for SIM applied (C) to the TIRF-STORM image (A). The area in the white box (C) is magnified by four times (D). The white scale bars are 2 micrometers (zoomed out) or 0.5 micrometers (zoomed in).
Figure 7
Figure 7
Graph Based Analysis of TIRF-STORM Image of a Human Dermal Fibroblast. TIRF-STORM localizations of fluorophores labeling Lamin A (A) are analyzed using several graph-based methods. The Euclidean Minimum Spanning Tree (EMST, cyan) connects all the detected fluorophores (dots) together using the shortest total line segment (B) and has been previously used to analyze lamin structures from single molecule localization microscopy [10]. A subgraph of the EMST is the Nearest Neighbor Graph (NNG, gold), which only connects fluorophore localizations with the next nearest localization without the requirement to connect all the fluorophores, as in EMST, and has been used to evaluate the relative density of A and B-type lamins [32]. The Voronoi Tessellation (C) draws lines (green) equidistant from two fluorophore coordinates resulting in polygons. The area within each polygon is the area closer to the single detected fluorophore contained within it than to fluorophores outside of the polygon and is used to approximate the reciprocal of the local fluorophore density. The Delaunay Triangulation [33,34] (D) (magenta) draws triangles between all the detected fluorophores, such that a circle drawn around the triangles does not contain another detected fluorophore, producing a more highly connected graph than the EMST. The EMST (cyan) is a subset of the edges of the Delaunay Triangulation (D) and the graphs are used to analyze the space between fluorophores. The nodes of the Voronoi are the centers of the circles going through the vertices of each triangle in the Delaunay Triangulation. Black scale bar is 100 nm.

Similar articles

Cited by

References

    1. Dechat T., Adam S.A., Taimen P., Shimi T., Goldman R.D. Nuclear lamins. Cold Spring Harb. Perspect Biol. 2010;2:a000547. doi: 10.1101/cshperspect.a000547. - DOI - PMC - PubMed
    1. Fawcett D.W. On the occurrence of a fibrous lamina on the inner aspect of the nuclear envelope in certain cells of vertebrates. Am. J. Anat. 1966;119:129–145. doi: 10.1002/aja.1001190108. - DOI - PubMed
    1. Aaronson R.P., Blobel G. Isolation of nuclear pore complexes in association with a lamina. Proc. Natl. Acad. Sci. USA. 1975;72:1007–1011. doi: 10.1073/pnas.72.3.1007. - DOI - PMC - PubMed
    1. Turgay Y., Eibauer M., Goldman A.E., Shimi T., Khayat M., Ben-Harush K., Dubrovsky-Gaupp A., Sapra K.T., Goldman R.D., Medalia O. The molecular architecture of lamins in somatic cells. Nature. 2017;543:261–264. doi: 10.1038/nature21382. - DOI - PMC - PubMed
    1. Turgay Y., Medalia O. The structure of lamin filaments in somatic cells as revealed by cryo-electron tomography. Nucleus. 2017;8:475–481. doi: 10.1080/19491034.2017.1337622. - DOI - PMC - PubMed

Publication types

LinkOut - more resources