. 2019 Jan-Dec:11:1759091419843393.
doi: 10.1177/1759091419843393.

Global Brain Transcriptome Analysis of a Tpp1 Neuronal Ceroid Lipofuscinoses Mouse Model

Affiliations

Global Brain Transcriptome Analysis of a Tpp1 Neuronal Ceroid Lipofuscinoses Mouse Model

Miriam S Domowicz et al. ASN Neuro. 2019 Jan-Dec.

Abstract

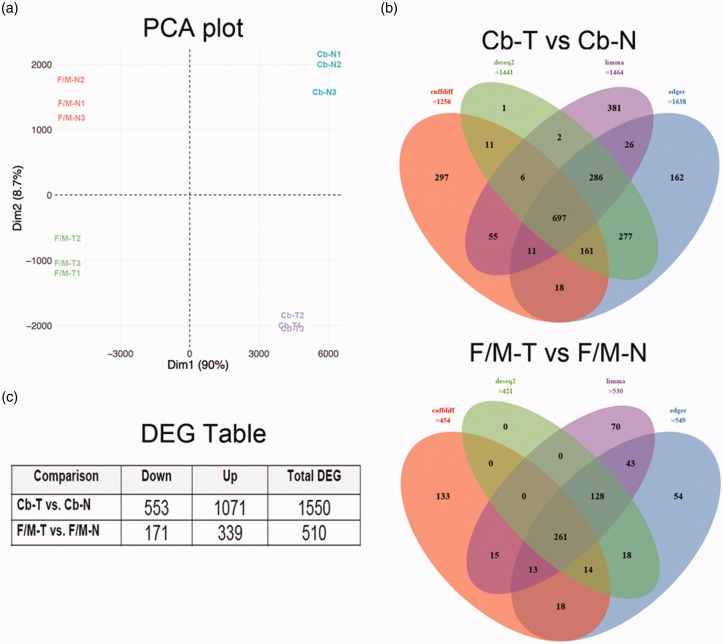
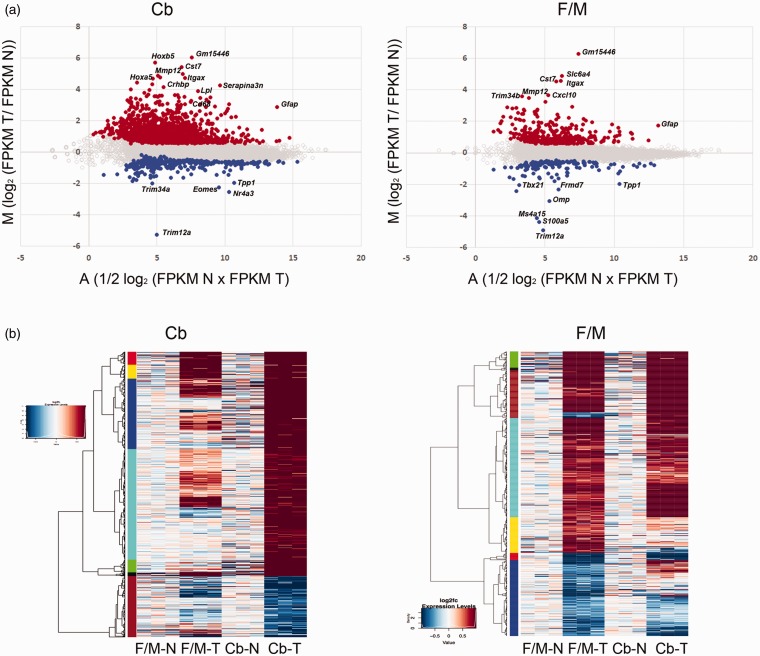
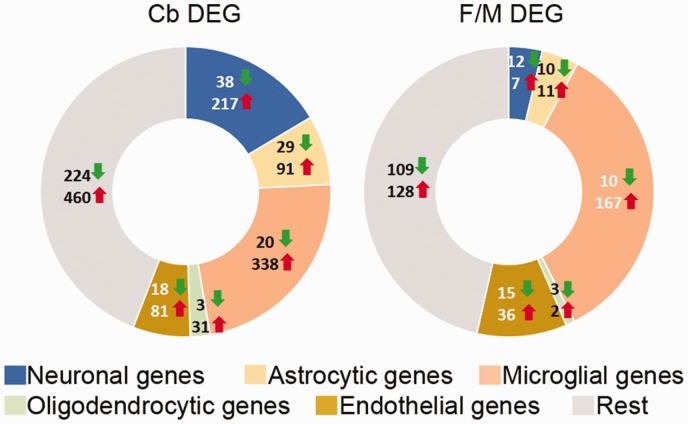
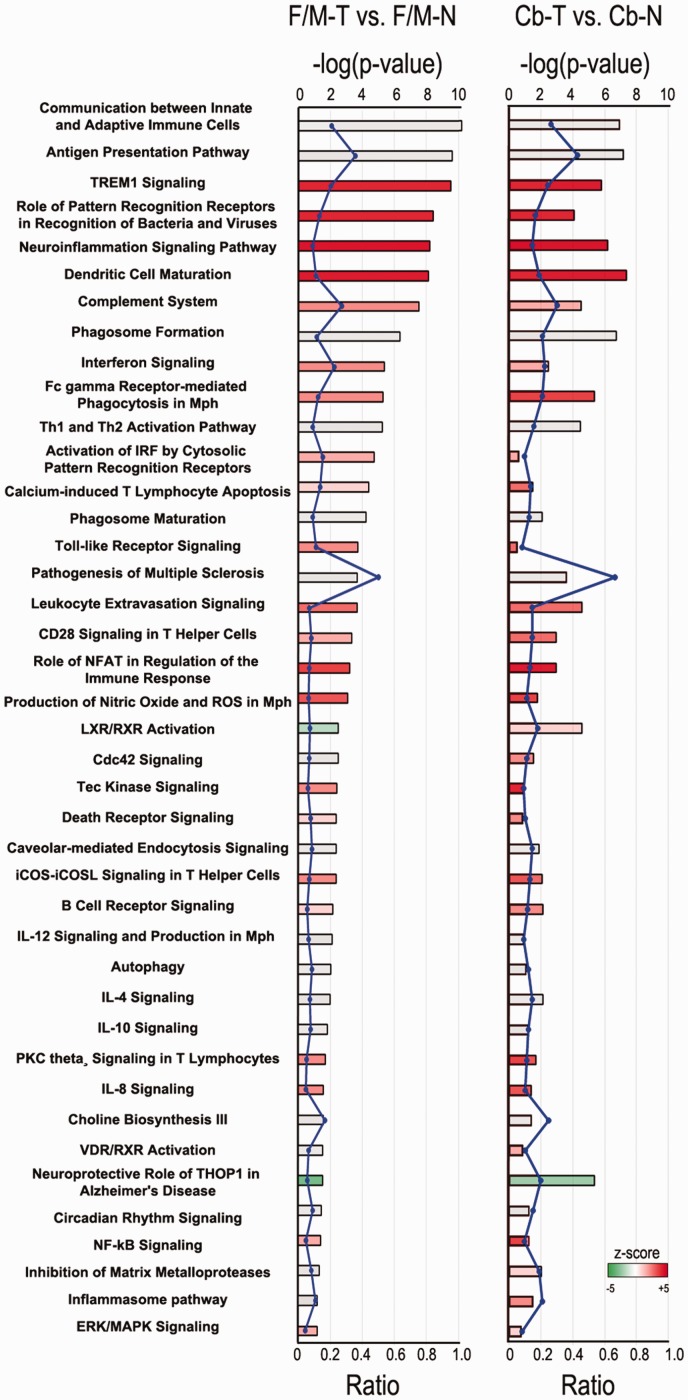
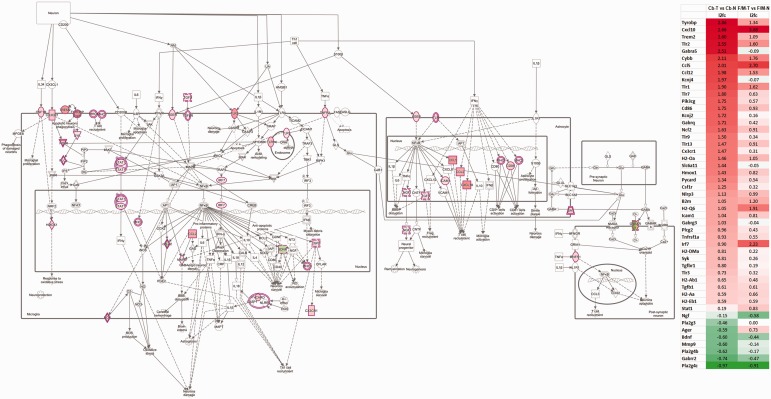
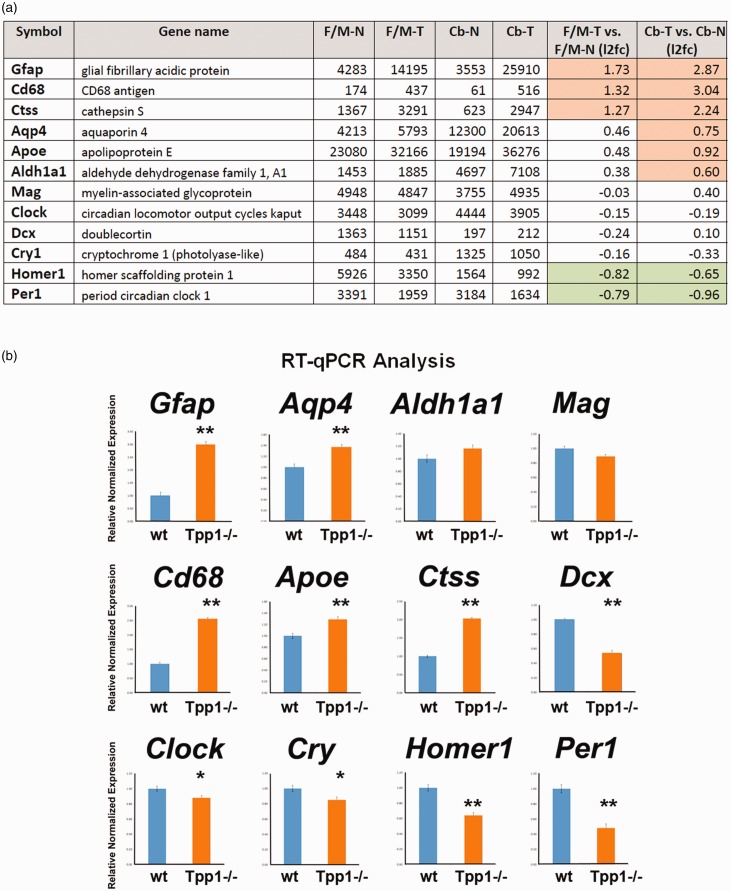
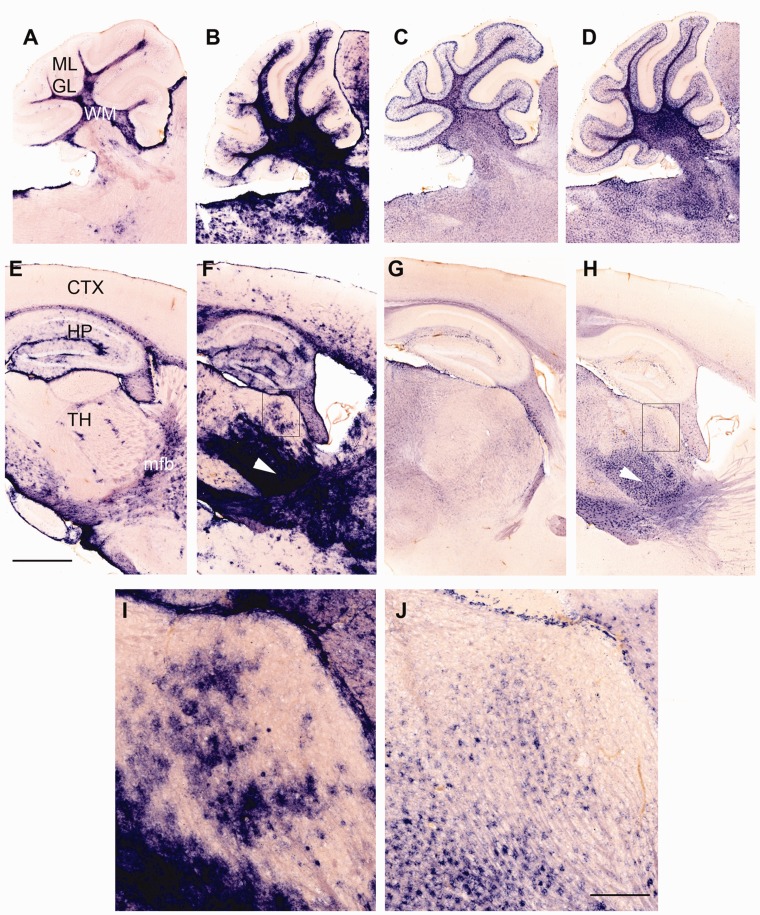
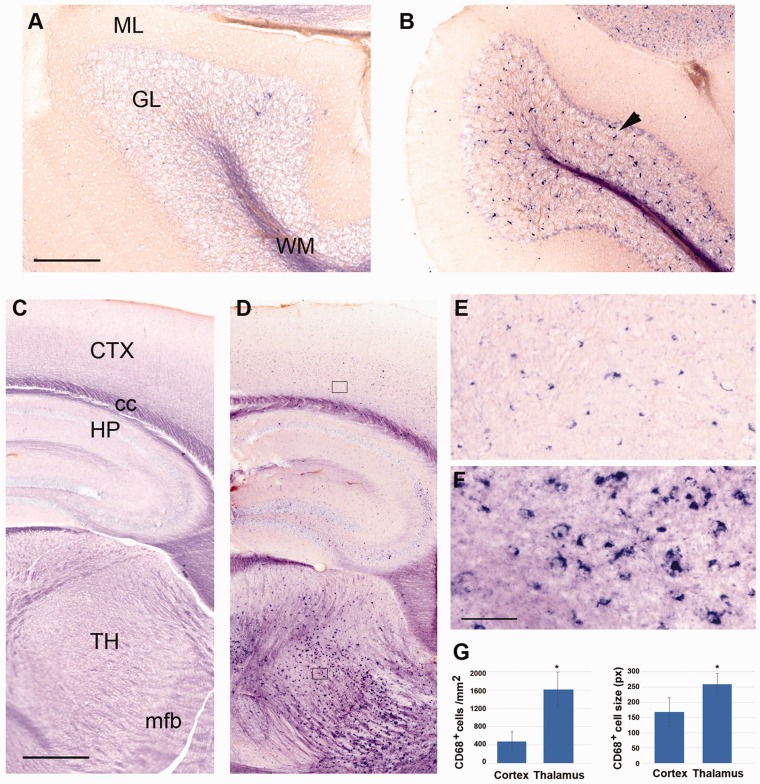
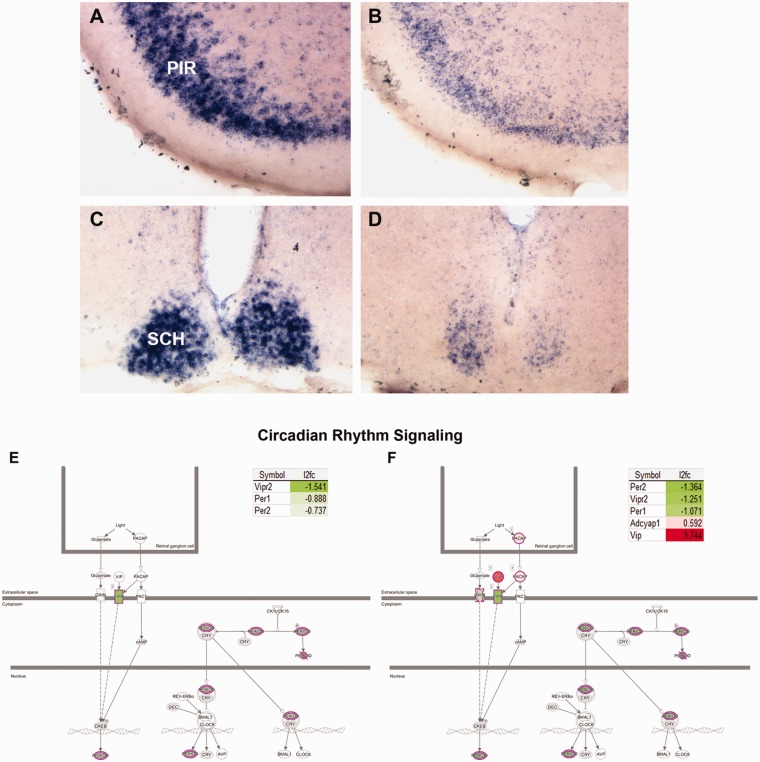
In humans, homozygous mutations in the TPP1 gene results in loss of tripeptidyl peptidase 1 (TPP1) enzymatic activity, leading to late infantile neuronal ceroid lipofuscinoses disease. Using a mouse model that targets the Tpp1 gene and recapitulates the pathology and clinical features of the human disease, we analyzed end-stage (4 months) transcriptional changes associated with lack of TPP1 activity. Using RNA sequencing technology, Tpp1 expression changes in the forebrain/midbrain and cerebellum of 4-month-old homozygotes were compared with strain-related controls. Transcriptional changes were found in 510 and 1,550 gene transcripts in forebrain/midbrain and cerebellum, respectively, from Tpp1-deficient brain tissues when compared with age-matched controls. Analysis of the differentially expressed genes using the Ingenuity™ pathway software, revealed increased neuroinflammation activity in microglia and astrocytes that could lead to neuronal dysfunction, particularly in the cerebellum. We also observed upregulation in the production of nitric oxide and reactive oxygen species; activation of leukocyte extravasation signals and complement pathways; and downregulation of major transcription factors involved in control of circadian rhythm. Several of these expression changes were confirmed by independent quantitative polymerase chain reaction and histological analysis by mRNA in situ hybridization, which allowed for an in-depth anatomical analysis of the pathology and provided independent confirmation of at least two of the major networks affected in this model. The identification of differentially expressed genes has revealed new lines of investigation for this complex disorder that may lead to novel therapeutic targets.

Keywords: circadian rhythm; lysosomal tripeptidyl peptidase 1; neuroinflammation; neuronal ceroid lipofuscinoses; pediatric neurodegeneration; transcriptome.


Figures

Figure 1.
Figure 1.
Statistical determination of DEG. (a) PCA plot of all samples based on normalized expressions. Control forebrain/midbrain (F/M-N), Tpp1/ forebrain/midbrain (F/M-T), control cerebellum (Cb-N), and Tpp1/ cerebellum (Cb-T) of triplicate samples are represented. (b) Venn diagram of differentially expressed mRNA genes identified by four different methods: Cuffdiff, edgeR, DESeq2, and limma. Only genes identified by at least two methods were used for further analysis. (c) Number of up-/downregulated DEG in different comparison(s). PCA = principal component analysis; DEG = differentially expressed genes.
Figure 2.
Figure 2.
Visualization of DEG. (a) MA plot representing the ratio of FPKM expression values between Tpp1/ cerebellum (Cb) and forebrain/midbrain (F/M) areas and their corresponding control areas (N) plotted against their average. The statistically significant genes with >1.5 fold change and false discovery rate of less than 0.1 are plotted in orange color (upregulated genes) and blue (downregulated genes). The rest of the genes are represented with gray open circles. (b) Heat map displaying the 1,550 and 510 genes that are differentially expressed between Wt (N) versus Tpp1/ (T) cerebellum (Cb) and forebrain/midbrain (F/M), respectively. Representation of the same genes in complementary samples is also included for comparison. Each column represents an individual triplicate. Red color represents relative increase in abundance, blue color represents relative decrease, and white color represents no change as measured by log2fc (Log2 of T vs. N ratio) and represented in the inset. The rows are organized by hierarchical clustering (represented at the left). FPKM= Fragments Per Kilobase of transcript per Million mapped reads.
Figure 3.
Figure 3.
Identification of cell-type-specific DEG in wt and Tpp1/ brain regions. Distribution of cell-type-specific genes that are commonly enriched (upregulated: red up arrow; downregulated green down arrow) in between DEG from Cb-T versus Cb-N and F/M-T versus F/M-N comparisons. Cell-type specificity of DEG was established from data imputed from Zhang et al. (2014; http://web.stanford.edu/group/barres_lab/brain_rnaseq.html) based on genes that were exclusively expressed in each cell type and had FPKM expression values at least five time higher than in the rest of the other cell types. DEG = differentially expressed genes.
Figure 4.
Figure 4.
Ingenuity Pathway Analysis (IPA) from DEG in Tpp1/ versus N mouse brain. Selected canonical pathways identified using IPA gene ontology algorithms for F/M and Cb areas scored as −log(p value) from Fisher’s exact test, set here to a threshold of 1.25. Bars are colored according to the z score (positive z score is red, negative z score is green, and no activity pattern available is gray). The ratio (blue dots connected by a line) indicates the ratio of genes from the dataset that map to the pathway divided by the total number of genes that map to the same pathway. For a complete list of canonical pathways and genes involved, see Table S2 and S3. F/M-N = control forebrain/midbrain; F/M-T = Tpp1/ forebrain/midbrain; Cb-N = control cerebellum; Cb-T = Tpp1/ cerebellum; NFAT = nuclear factor of activated T-cells; ROS = reactive oxygen species; LXR = liver X receptor; RXR = retinoid X receptor; iCOS = inducible T-cell costimulator; iCOSL = inducible T-cell costimulator ligand; IL = interleukin; VDR = vitamin D receptor; PKC= protein kinase C; NFκB = nuclear factor kappa-light-chain-enhancer of activated B cells; ERK = extracellular signal-regulated kinases; MAPK = mitogen-activated protein kinases.
Figure 5.
Figure 5.
Neuroinflammation pathway. Canonical pathway analysis by IPA highlights the genes affected in the neuroinflammation pathways for Cb and F/M. Involved DEG detected by RNA-seq analysis and change ratio (l2fc=log2 of T. N ratio) are indicated to the right. F/M-N = control forebrain/midbrain; F/M-T = Tpp1/ forebrain/midbrain; Cb-N = control cerebellum; Cb-T = Tpp1/ cerebellum.
Figure 6.
Figure 6.
Corroboration of RNA-seq results by RT-qPCR for selected genes. (a) Table counts per million (CPM) data from RNA-seq study and log2 of Tpp1–/– (T) versus control (N) ratio (l2fc) in Cb and F/M for 12 genes. Significant change ratios are highlighted in pink (upregulated) and green (downregulated genes). (b) Relative transcript expression of the same 12 genes quantified by qPCR in independent F/M RNA extractions, performed in triplicate. Relative normalized expression values were determined from the ΔΔCt for the indicated target genes relative to Actb (β–actin) expression in control brains. *p < .02; **p < .0001. F/M-N = control forebrain/midbrain; F/M-T = Tpp1/ forebrain/midbrain; Cb-N = control cerebellum; Cb-T = Tpp1/ cerebellum; l2fc=log2 of T. N ratio; Tpp1 = tripeptidyl peptidase 1; RT-qPCR = quantitative real-time reverse transcription polymerase chain reaction; Gfap = glial fibrillary acidic protein; Aqp4 = aquaporin 4; Cd68 = CD68 antigen; Per1 = period1.
Figure 7.
Figure 7.
Altered expression patterns of astrocytic markers in Tpp1/ 4-month-old brains. Expression patterns of GFAP (a, b, e, f, i) and Aqp4 (c, d, g, h, j) transcripts in Tpp1/ (b, f, i and d, h, j) and control (a, e and d, h) in 4-month-old brains by in situ hybridization (blue staining). Cerebellar (a to d) and forebrain areas (e to i) are shown. (i) and (j) depict close-ups of areas indicated in (f) and (h). White arrowhead in (f) and (h) indicates ventral thalamus. Scale bars: (a) to (g) = 1,000 μm; (i) and (j) = 200 μm. ML = molecular layer; GL = granular layer; WM = molecular matter; CTX = cortex; HP = hippocampus; TH = thalamus; mfb = medial forebrain bundle.
Figure 8.
Figure 8.
Altered expression patterns of Cd68 in Tpp1/ 4-month-old brains. Expression pattern of CD68 mRNA in cerebellum (a and b) and forebrain (c to f) in Tpp1/ (b, d, e, f) and control (a, c) 4-month-old brains by in situ hybridization (blue staining). (e) and (f) represent an enlargement of sections boxed in (d). Quantification of the number of CD68+ cell per mm2 and cell size (in pixels) for Tpp1/ cortex and thalamus are compared in (g). Black arrowhead indicates CD68+ cells in granular cell layer of Tpp1/ cerebellum. Scale bars: (a) and (b) = 200 μm; (c) and (d) = 500 μm; (e) and (f) = 50 μm. ML = molecular layer; GL = granular layer; WM = white matter; CTX = cortex; cc = corpus callosum; HP = hippocampus; TH = thalamus; mfb = medial forebrain bundle.
Figure 9.
Figure 9.
Loss of circadian rhythm gene expression in Tpp1/ brains. Loss of Per1 mRNA expression in PIR (a and b) and the SCH (c and d) in Tpp1/ (b, d) 4-month-old brains compared with control heterozygous (a, c). Canonical pathway analysis by IPA highlights the genes affected in the circadian rhythm signaling pathways for F/M (e) and Cb (f). Involved DEG detected by RNA-seq analysis and change ratio (l2fc=log2 of T vs. N ratio) are indicated. PIR = piriform cortex; SCH = suprachiasmatic nuclei.

Similar articles

Cited by

References

    1. Abreu T., Braganca , M. (2015). The bipolarity of light and dark: A review on bipolar disorder and circadian cycles. J Affect Disord, 185, 219–229. - PubMed
    1. Akiyama H., Nishimura T., Kondo H.Ikeda, K., Hayashi, Y., & McGeer, P. L. (1994). Expression of the receptor for macrophage colony stimulating factor by brain microglia and its upregulation in brains of patients with Alzheimer’s disease and amyotrophic lateral sclerosis. Brain Res, 639, 171–174. - PubMed
    1. Anderson G. W., Goebel H. H., Simonati , A. (2013). Human pathology in NCL. Biochim Biophys Acta, 1832, 1807–1826. - PubMed
    1. Andrews S. (2010). FastQC: A quality control tool for high throughput sequence data Retrieved from http://www.bioinformatics.babraham.ac.uk/projects/fastqc/
    1. Bevan R. J., Evans R., Griffiths L.Watkins, L. M., Rees, M. I., Magliozzi, R., Allen, I., McDonnell, G., Kee, R., Naughton, M., Fitzgerald, D. C., Reynolds, R., Neal, J. W., & Howell, O. W. (2018). Meningeal inflammation and cortical demyelination in acute multiple sclerosis. Ann Neurol, 84, 829–842. - PubMed

Publication types

MeSH terms