. 2019 May:43:447-453.
doi: 10.1016/j.ebiom.2019.04.022. Epub 2019 Apr 16.

Deep learning only by normal brain PET identify unheralded brain anomalies

Affiliations

Deep learning only by normal brain PET identify unheralded brain anomalies

Hongyoon Choi et al. EBioMedicine. 2019 May.

Abstract

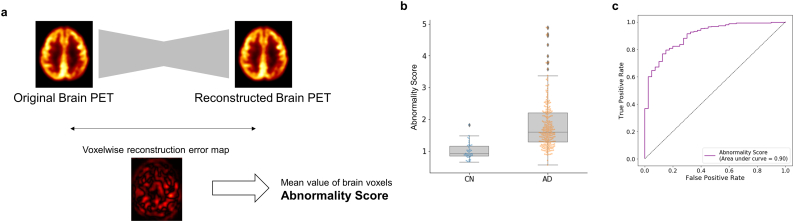
Background: Recent deep learning models have shown remarkable accuracy for the diagnostic classification. However, they have limitations in clinical application due to the gap between the training cohorts and real-world data. We aimed to develop a model trained only by normal brain PET data with an unsupervised manner to identify an abnormality in various disorders as imaging data of the clinical routine.

Methods: Using variational autoencoder, a type of unsupervised learning, Abnormality Score was defined as how far a given brain image is from the normal data. The model was applied to FDG PET data of Alzheimer's disease (AD) and mild cognitive impairment (MCI) and clinical routine FDG PET data for assessing behavioral abnormality and seizures. Accuracy was measured by the area under curve (AUC) of receiver-operating-characteristic (ROC) curve. We investigated whether deep learning has additional benefits with experts' visual interpretation to identify abnormal patterns.

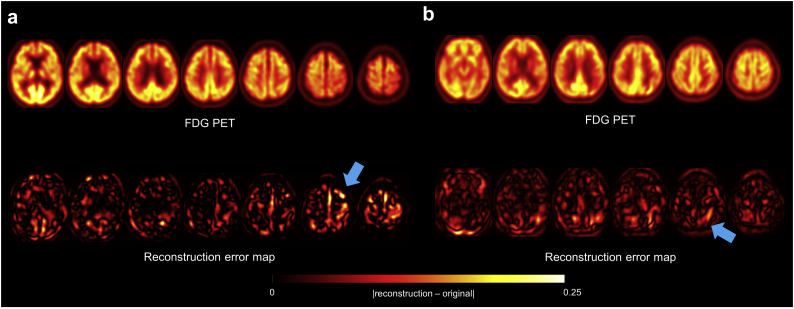
Findings: The AUC of the ROC curve for differentiating AD was 0.90. The changes in cognitive scores from baseline to 2-year follow-up were significantly correlated with Abnormality Score at baseline. The AUC of the ROC curve for discriminating patients with various disorders from controls was 0.74. Experts' visual interpretation was helped by the deep learning model to identify abnormal patterns in 60% of cases initially not identified without the model.

Interpretation: We suggest that deep learning model trained only by normal data was applicable for identifying wide-range of abnormalities in brain diseases, even uncommon ones, proposing its possible use for interpreting real-world clinical data.

Keywords: Alzheimer; Anomaly detection; Deep learning; PET; Variational autoencoder.


Figures

Fig. 1
Fig. 1
Abnormality Score of Alzheimer's disease (AD) patients and normal controls. (a) A brief overview of the estimation of abnormality and reconstruction error maps is presented. A variational autoencoder model was trained using brain PET images of cognitively normal subjects. A given brain PET data with abnormal metabolic patterns compared with normal brain distribution shows high reconstruction error. Reconstruction error maps were obtained and mean errors of brain voxels were defined as Abnormality Score. Abnormality Score was measured for AD patients and controls. (b) Abnormality Score of AD patients was significantly higher than that of normal controls (1.93 ± 0.83 vs. 0.99 ± 0.25, p < 1 × 10−15). (c) Receiver-operating-characteristic (ROC) curve analysis was performed to differentiate AD and controls using Abnormality Score. As a performance parameter, the area under curve (AUC) was 0.90.
Fig. 2
Fig. 2
Reconstruction error maps of AD patients. The output of the model, variational autoencoder, is the reconstructed PET images. The reconstruction error map is obtained by voxelwise mean-squared-error. Voxels with high mean-squared-error represent the location of abnormal patterns as voxelwise reconstruction errors represent contributions of Abnormality Score of the whole brain. (a) The reconstruction error maps were drawn for AD patients. Patients showed different patterns of abnormality, which commonly included the posterior cingulate, bilateral parietal cortices and medial frontal cortices. (b) Overall abnormal patterns of AD patients were generated by the mean image of the reconstruction error maps of AD patients.
Fig. 3
Fig. 3
Abnormality Score as a predictive biomarker for predicting future cognitive decline. We applied our model to brain FDG PET scans of MCI patients. (a) Abnormality Scores of MCI-converters and MCI-nonconverters were significantly different. Those of MCI-converters were significantly higher (1.22 ± 0.42 vs 1.07 ± 0.33; U = 1.2 × 10 [4], p < 1 × 10−4). (b) We evaluated whether Abnormality Score at baseline PET scans predicted the future change of cognitive scores, including Mini-Mental State Exam (MMSE) (B) Clinical Dementia Rating Sum of Boxes (CDR-SB) (c). (b) MMSE changes for 2-years were negatively correlated with Abnormality Score (r = −0.19, p < 1 × 10−4). (c) CDR-SB changes for 2-years were also positively correlated with Abnormality Score (r = 0.19, p < 1 × 10−4). Note that red dots represent MCI-converters and blue dots represent MCI-nonconverters. (For interpretation of the references to colour in this figure legend, the reader is referred to the web version of this article.)
Fig. 4
Fig. 4
Identification of abnormal metabolic patterns aided by the reconstruction error map. (a) Brain FDG PET image of a patient with autoimmune encephalitis was initially interpreted as it showed normal brain metabolism pattern according to the experts' reading. The reconstruction error map highlighted the relatively high reconstruction error in the left frontal cortex, which corresponded to the clinical symptom, right side movement abnormality. (b) Identification of abnormality in the left parietal cortex in brain PET images of patients with parietal lobe epilepsy was aided by the reconstruction error map.

Similar articles

Cited by

References

    1. LeCun Y., Bengio Y., Hinton G. Deep learning. Nature. 2015;521(7553):436. - PubMed
    1. Esteva A., Kuprel B., Novoa R.A. Dermatologist-level classification of skin cancer with deep neural networks. Nature. 2017;542(7639):115. - PMC - PubMed
    1. Gulshan V., Peng L., Coram M. Development and validation of a deep learning algorithm for detection of diabetic retinopathy in retinal fundus photographs. Jama. 2016;316(22):2402–2410. - PubMed
    1. Ithapu V.K., Singh V., Okonkwo O.C. Imaging-based enrichment criteria using deep learning algorithms for efficient clinical trials in mild cognitive impairment. Alzheimers Dement. 2015;11(12):1489–1499. - PMC - PubMed
    1. Choi H., Jin K.H., Initiative AsDN Predicting cognitive decline with deep learning of brain metabolism and amyloid imaging. Behav Brain Res. 2018;344:103–109. - PubMed

Substances