. 2019 May 8;25(5):756-765.e5.
doi: 10.1016/j.chom.2019.03.003. Epub 2019 Apr 16.

Colitis-Induced Th17 Cells Increase the Risk for Severe Subsequent Clostridium difficile Infection

Affiliations

Colitis-Induced Th17 Cells Increase the Risk for Severe Subsequent Clostridium difficile Infection

Mahmoud M Saleh et al. Cell Host Microbe. .

Abstract

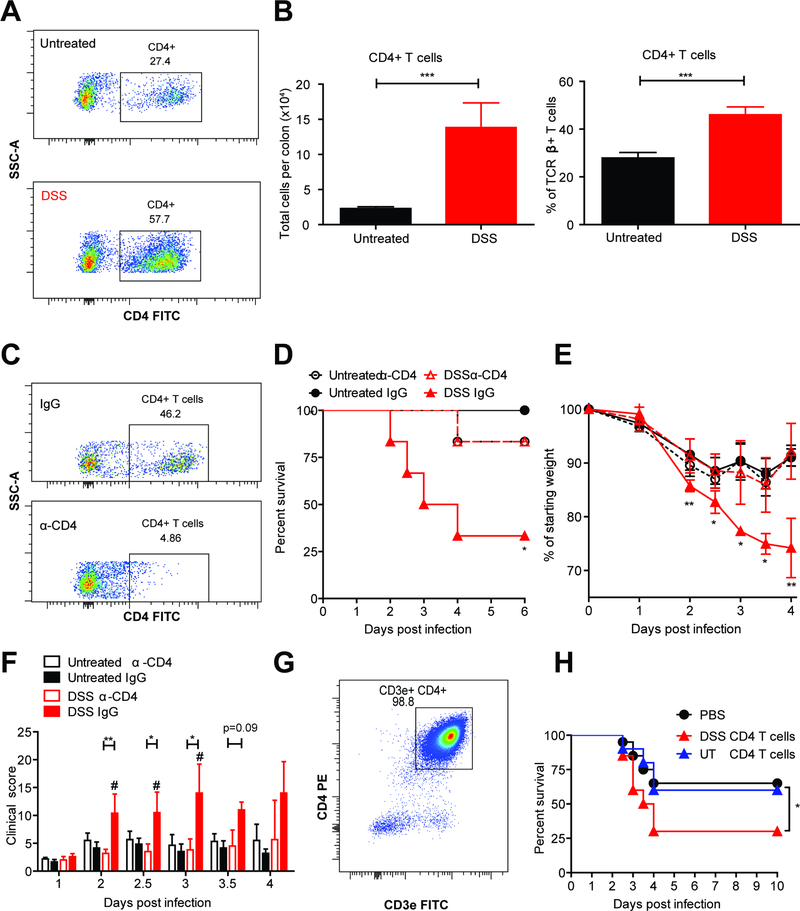
Clostridium difficile infection (CDI) is the number one hospital-acquired infection in the United States. CDI is more common and severe in inflammatory bowel disease patients. Here, we studied the mechanism by which prior colitis exacerbates CDI. Mice were given dextran sulfate sodium (DSS) colitis, recovered for 2 weeks, and then were infected with C. difficile. Mortality and CDI severity were increased in DSS-treated mice compared to controls. Severe CDI is dependent on CD4+ T cells, which persist after colitis-associated inflammation subsides. Adoptive transfer of Th17 cells to naive mice is sufficient to increase CDI-associated mortality through elevated IL-17 production. Finally, in humans, the Th17 cytokines IL-6 and IL-23 associate with severe CDI, and patients with high serum IL-6 are 7.6 times more likely to die post infection. These findings establish a central role for Th17 cells in CDI pathogenesis following colitis and identify them as a potential target for preventing severe disease.

Keywords: CD4 T cells; Clostridium difficile; DSS; IL-17A; IL-23; IL-6; Th17 cells; adaptive immunity; colitis; inflammatory bowel disease.


Conflict of interest statement

Declaration of Interests

W.A.P. is a consultant for TechLab, a company that makes diagnostics for CDI. Some of the data in this manuscript was used to file U.S. Provisional Patent Application Serial No. 62/630,370.

Figures

Figure 1:
Figure 1:. Increased CDI-associated mortality in mice with prior DSS colitis.
6-week old C57Bl/6J mice were treated with 2% DSS or no treatment in the drinking water for 6 days, then allowed to recover for 2 weeks. Both groups were treated with antibiotics and infected with 1×10⁶-1×10⁷ CFU of C. difficile strain R20291. (A) Model for CDI after recovery from DSS colitis. (B) DSS-induced weight loss and recovery before C. difficile infection (n=18–19 per group). (C) FITC dextran detection assay in the serum was used to determine gut permeability in untreated mice, during acute DSS colitis, and after recovery from DSS colitis (n=8–10 per group). After infection, survival (D), clinical scores: weight loss, coat appearance, eyes/nose discharge, activity, posture and diarrhea (E) and weight loss (F) of the two groups were assessed twice a day for 7 days (n=16 per group). Day 0 post infection in (D-F) refers to Day 27 in the timeline in (A). (G) Caecal contents were collected from mice with/without prior DSS colitis on day 2. The samples were homogenized and plated anaerobically on C. difficile- selective agar plates (n=10–14 per group). (H) Toxins were detected within caecal contents using the C. difficile TOXA/B enzyme-linked immunosorbent assay (ELISA) according to the manufacturer’s instructions (n=18 per group). Data represent mean ± SEM.*p<0.05, **p<0.01, ***p<0.001, ****p<0.0001 by two-tailed t-test (B, F-H), one-way analysis of variance (C), Logrank statistical test (D) and Mann-Whitney test (E). These data are combined from two independent experiments. See also Figures S1 and S2.
Figure 2:
Figure 2:. CD4+ T cells increase C. difficile disease severity in mice with prior DSS colitis.
Mice were given DSS or regular water (as described before), recovered for 2 weeks and infected with C. difficile. Colon tissue was isolated, processed into single-cell suspension and stained for flow cytometry. (A) Representative flow plots depicting colonic CD4+ T cells (CD45+ TCRβ+). (B) Quantification of colonic CD4+ T cells (n=10–12 per group). (C-F) Mice were injected i.p. with 400μg α-CD4 or IgG isotype control on days −6, −3 and on the day of infection with C. difficile. (C) Representative flow plots showing depletion of colonic CD4 T cells. (D-F) Survival, weight loss and clinical scores were assessed twice daily for 6 days (n=6 per group). (G) Donor mice were given 2% DSS or regular water for 6 days. On day 7, CD4+ T cells were isolated from the colon and mesenteric lymph nodes using negative selection magnetic beads and the purity was checked by flow cytometry. (H) 1×10⁶ CD4+ T cells were transferred into naïve, antibiotic-treated recipients. The following day, recipient mice were infected with C. difficile. Survival curves were compared using a Logrank statistical test. Weight loss and clinical scores were compared using a one-way analysis of variance and Kruskal Wallis test, respectively (n=10 per group per experiment). Data represent mean ± SEM. *p<0.05, **p<0.01, ***p<0.001. # p<0.05: DSS IgG compared to Untreated IgG. Data are combined from two independent experiments. See also Figure S3.
Figure 3:
Figure 3:. Increased Th17 responses in mice with prior DSS colitis cause severe subsequent CDI.
(A-D) Mice were given DSS or regular water (as described before), recovered for 2 weeks and infected with C. difficile. On day 2 of infection, colon and mesenteric lymph node tissue was isolated, processed into single-cell suspension and stained for flow cytometry. (A) Representative flow plots and quantification of Th17 cells (CD45+ TCRβ+ CD4+ RORγt+ FOXP3-) (n=5–6 per group per experiment). (B) IL-17-GFP reporter mice were used to determine the number and frequency of IL-17A+ CD4 T cells during infection by flow cytometry (n=5 per group per experiment). (C) For protein data, caecal tissue was homogenized using a bead beater, data is normalized to total protein quantified using a Pierce BCA Assay (n=8–14 per group). (D) caecal IL-23 protein levels plotted against clinical scores. (E) Mice were injected i.p. with 125μg α-IL-17RA or IgG isotype control on days −1, 1 and 2 of infection (n=16 per group). (F-I) Naïve CD4+ T cells were isolated from the spleen of IL17A-GFP reporter mice and differentiated into Th17 cells ex vivo in the presence of TGFβ and IL-6. (F) CD3e+CD4+IL-17A+ and CD3e+CD4+IL-17A- T cells were sorted and 1×10⁶ cells were transferred i.p. to antibiotic-treated recipients. (G-I) One day following the T cell transfer, recipients were infected with C. difficile. Survival, weight loss and clinical scores were assessed twice daily (n= 10 per group). Data represent mean ± SEM.*p<0.05, **p<0.01, ***p<0.001 by a two-tailed student t-test (A-C), Pearson correlation statistical test (D), Logrank statistical test (E,G), Kruskal-Wallis test (H) and one-way analysis of variance (I). Data are representative of two independent experiments. See also Figures S3 and S4.
Figure 4:
Figure 4:. The Th17 cytokines IL-6 and IL-23 in the serum of C. difficile patients correlate with severe disease.
IL-23 and IL-17A in the serum of C. difficile patients were quantified using high sensitivity ELISAs from R&D. IL-6 and IL-4 were quantified using a Luminex bead-based multiplex assay. (A) Kaplan-Meier survival curve post CDI diagnosis for patients with non-severe CDI (WBC<15,000 per microliter, n=226) and severe CDI (WBC≥15,000 per microliter, n=100). (B) serum IL-17A, IL-23, IL-6 and IL-4 for patients with non-severe and severe CDI, n=323, 323 and 362, 379 respectively. (C) Kaplan-Meier survival curve post CDI diagnosis for patients categorized into quartiles based on IL-6 serum levels, n=92–94 per quartile. Data represent mean ± SEM.*p<0.05, **p<0.01, ***p<0.001 using Logrank (A,C) and Mann-Whitney (B) statistical tests. See also Table S1.

Comment in

References

    1. Abt MC, Lewis BB, Caballero S, Xiong H, Carter RA, Sušac B, Ling L, Leiner I, and Pamer EG (2015). Innate Immune Defenses Mediated by Two ILC Subsets Are Critical for Protection against Acute Clostridium difficile Infection. Cell Host & Microbe 18, 27–37. - PMC - PubMed
    1. Ahern PP, Izcue A, Maloy KJ, and Powrie F (2008). The interleukin-23 axis in intestinal inflammation. Immunological Reviews 226, 147–159. - PubMed
    1. Alex P, Zachos NC, Nguyen T, Gonzales L, Chen T-E, Conklin LS, Centola M, and Li X (2009). Distinct Cytokine Patterns Identified from Multiplex Profiles of Murine DSS and TNBS-Induced Colitis: Inflammatory Bowel Diseases 15, 341–352. - PMC - PubMed
    1. Ananthakrishnan AN, McGinley EL, and Binion DG (2008). Excess hospitalisation burden associated with Clostridium difficile in patients with inflammatory bowel disease. Gut 57, 205–210. - PubMed
    1. Arai Y, Takanashi H, Kitagawa H, and Okayasu I (1998). Involvement of interleukin-1 in the development of ulcerative colitis induced by dextran sulfate sodium in mice. Cytokine 10, 890–896. - PubMed

MeSH terms